Day trading risk management: the rules that keep you trading
By Scalpel Team. , updated . 13 min read.
In short
Day trading risk management is a short set of rules you fix before the open: risk the same small amount on every trade (your 1R, often 0.5% to 1% of the account), work out the share count from the stop distance, stop for the day after a loss of a few R, cap the dollars in any one stock, and size for exits that fill worse than your stop. None of this makes a strategy profitable. It keeps a bad week, a gap or a halt from ending your trading before you find out whether the strategy works.
Most people who day trade lose money, and the research is blunt about it. Fernando Chague, Rodrigo De-Losso and Bruno Giovannetti followed every individual who started day trading Brazilian equity futures from 2013 to 2015 and kept at it for at least 300 days: 97% of them lost money, and only 0.4% earned more than a bank teller's US$54 a day (FGV EESP working paper 525, 2020). In Taiwan, Brad Barber, Yi-Tsung Lee, Yu-Jane Liu, Terrance Odean and Ke Zhang estimate that 97% of day traders are likely to lose money in future day trading, and that 74% of day trading volume comes from traders with a history of losses (Review of Asset Pricing Studies, 2020).
We build Scalpel, a trading cockpit for Interactive Brokers, and we read those numbers as the case for risk rules, not against trying. Risk management will not turn a losing method into a winning one. What it does is make the cost of finding out small and survivable. This pillar covers every rule, with the arithmetic, and links the detailed post on each one. Scalpel is independent and not affiliated with or endorsed by Interactive Brokers.
Day trading risk management: the five rules
| Rule | What you decide | A typical starting point | The detailed post |
|---|---|---|---|
| Risk per trade | Your 1R: the dollars you lose if the stop is hit | 0.5% to 1% of the account | Risk reward ratio |
| Position size | Shares = 1R / stop distance | Worked out on every trade, never guessed | Position sizing |
| The stop | Where you are wrong, and which order gets you out | Under the level that proves you wrong | Stop loss placement |
| Daily loss limit | The loss that ends your day | 3R to 4R | Max daily loss |
| Exposure caps | The most dollars in one order and one stock | Below what the bid can absorb | This post, below |
The order matters. Risk per trade comes first because everything else is measured in it. Size follows from the stop. The daily limit is a multiple of 1R. The caps catch the trades where the first three rules produce a number you should not trade.
Risk per trade: pick your 1R and keep it fixed
R is the amount you lose when a trade hits its stop: the distance from entry to stop, times the shares (R multiples, glossary: R multiple). Every other number in this post is a multiple of it, so pick it first and keep it the same from trade to trade.
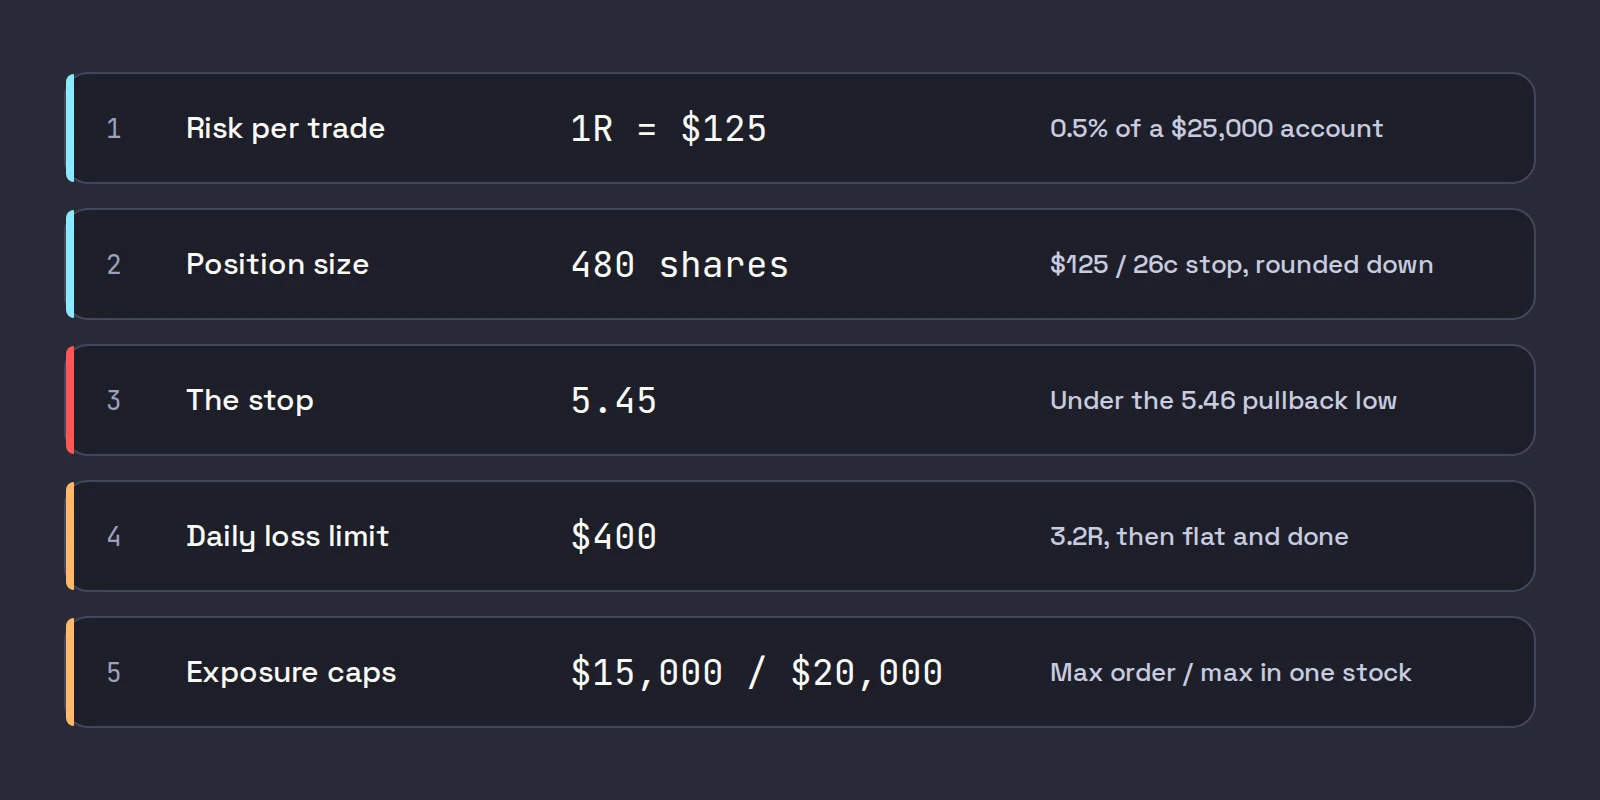
How big? Our view: 0.5% to 1% of the account while you are still proving a method, and less in your first live weeks. On a $25,000 account that is $125 to $250. The reason is not caution for its own sake. It is losing streaks, which are longer than most people expect.
Assume trades are independent and you win 40% of them. That is a realistic rate for a method with 2R winners. Over 500 trades, a few months of active scalping, our arithmetic puts the chance of at least one run of 8 losers in a row at about 97%, and of 10 in a row at about 70%. At a 45% win rate, a run of 10 is still about a 43% chance. Plan for 10 straight losers as an ordinary event, not a disaster.
| Risk per trade | After 10 straight losers | Gain needed to get back |
|---|---|---|
| 0.5% | -4.9% | +5.1% |
| 1% | -9.6% | +10.6% |
| 2% | -18.3% | +22.4% |
| 5% | -40.1% | +67.0% |
At 1% a bad streak is a bad month. At 5% it is a different account. That gap is the whole argument for small, fixed risk.
Fixed matters as much as small. If 1R is $50 on one trade and $400 on the next, one oversized loser wipes out a week of careful ones, and your results stop telling you anything. A risk preset that sizes from the stop keeps it fixed for you (trade a fixed dollar risk).
Drawdown math: why losses cost more than gains pay back
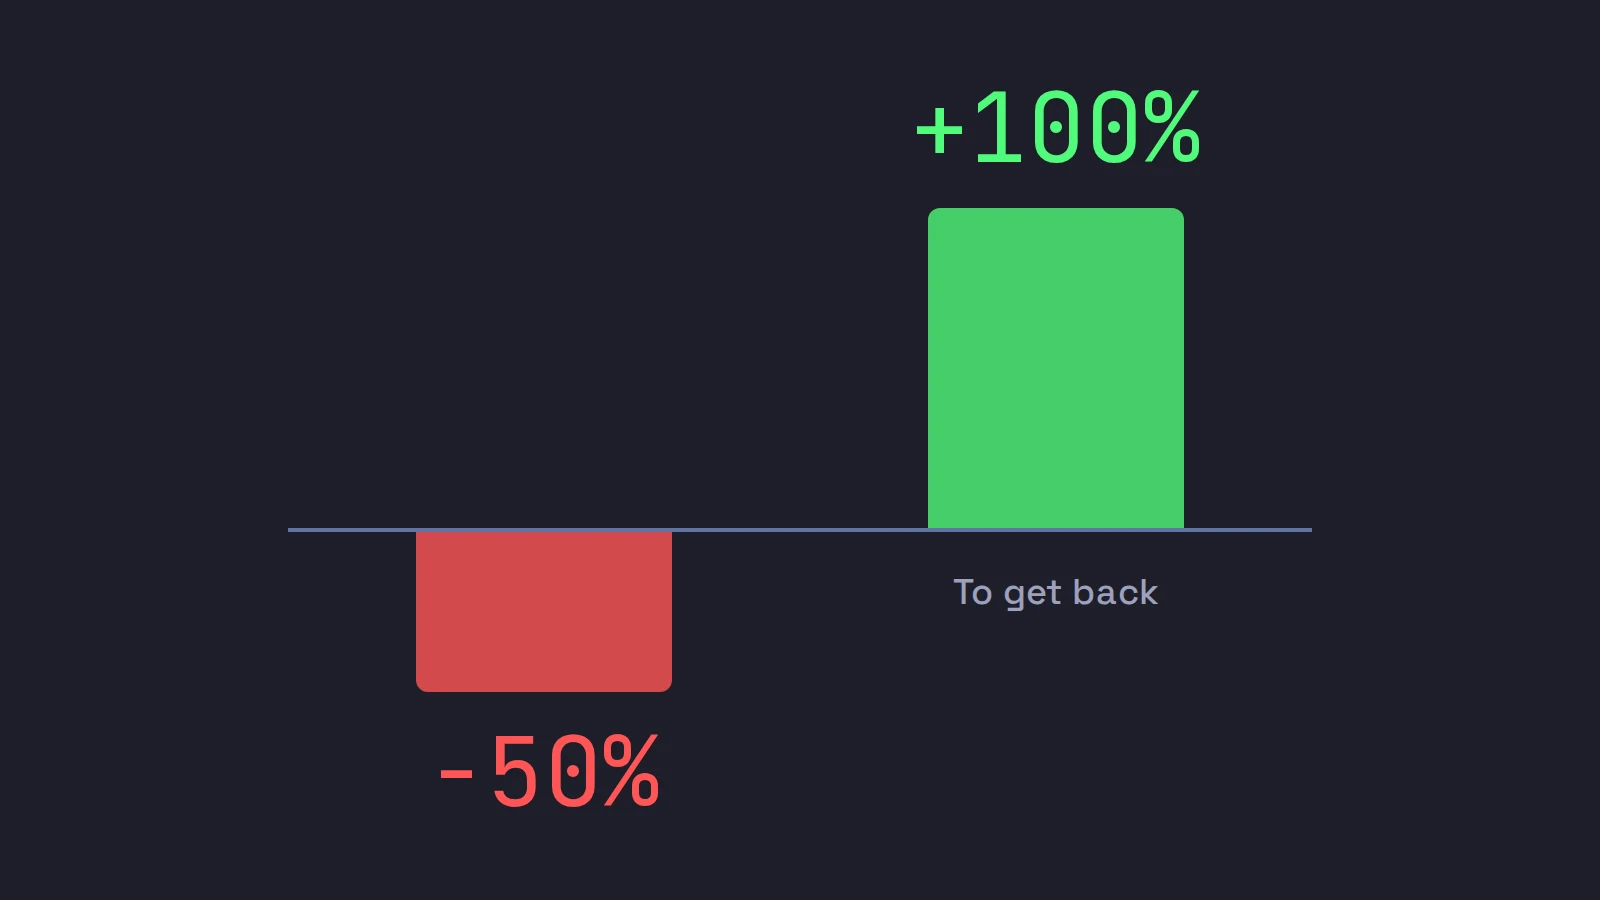
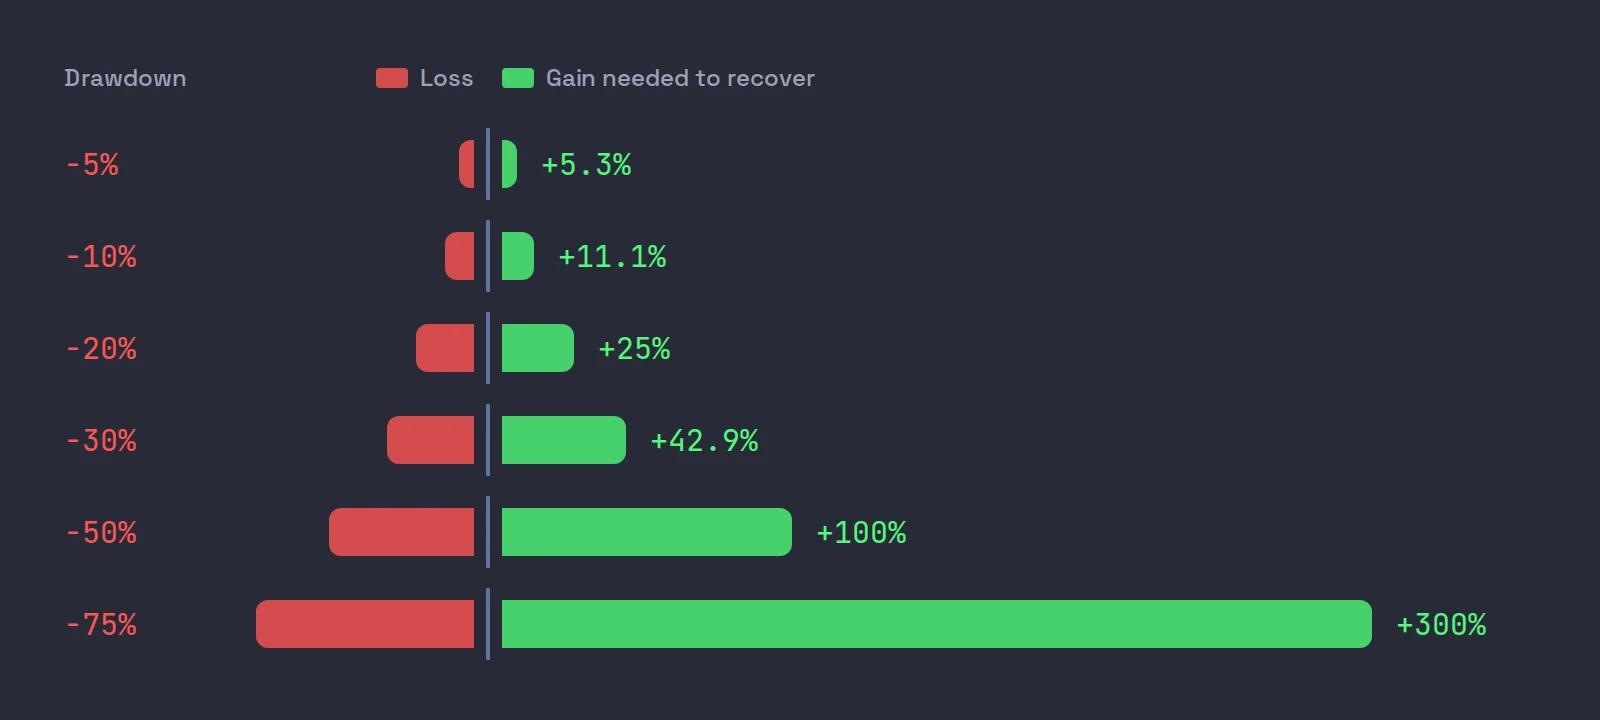
A drawdown is the fall from your account's high to its low. The arithmetic is not symmetrical: after a loss you have less money working, so the gain needed to recover is always bigger than the loss.
| Drawdown | Gain needed to recover |
|---|---|
| -5% | +5.3% |
| -10% | +11.1% |
| -20% | +25% |
| -30% | +42.9% |
| -50% | +100% |
| -75% | +300% |
The formula is 1 / (1 - loss) - 1. Small drawdowns are close to symmetrical. Past about 20% the curve bends hard, and at 50% you need to double what is left. Everything in day trading risk management exists to keep you on the flat part of this curve.
Size every position from the stop
Once 1R is fixed, the share count is not a choice. It falls out of the stop:
Shares = 1R / (entry - stop), rounded down.
You risk $125. ABCD's ask is 5.71, and the level that proves you wrong is a pullback low at 5.46, so the stop goes at 5.45, 26 cents under the ask. $125 / 0.26 = 480.8, so you buy 480 shares, about $2,741. On WXYZ at 12.40 with a 45 cent stop, the same $125 buys 277 shares, about $3,435. Different stocks, different share counts, the same loss at the stop.
The common mistake is the reverse: a habit of "500 shares" that risks $50 on a quiet stock and $250 on a jumpy one. The full method, with rounding, buying power and liquidity caps, is in position sizing for day trading. If you set the stop from volatility rather than structure, ATR stops and ATR position sizing covers the formula.
Stops: where they go, and what they cannot do
A stop is the price where your trade idea is wrong. It goes under the level that would prove that, such as a pullback low, VWAP or a whole dollar, not at a dollar amount you are comfortable losing. Pick the level first, then let the size absorb the distance. Where to put your stop loss goes through each kind.
Then there is the order that carries the stop. A plain stop becomes a market order when it triggers; a stop-limit becomes a limit order. The SEC's investor bulletin on stop, stop-limit and trailing stop orders puts the trade-off plainly: the stop price "is not the guaranteed execution price," while a stop-limit "may not be executed if the stock's price moves away from the specified limit price." Stop-limit vs stop-market works through both on a gap.
Three more posts in this cluster cover the practical cases:
- Outside regular hours, exchanges take limit orders only, so a plain stop does nothing before 09:30 ET. Why your stop loss did not trigger in the pre-market explains it and what you can do in TWS.
- A bracket order on IBKR puts the stop and the target on with the entry, so you are never in a trade without one.
- After the trade works, moving your stop to break-even and trailing stops decide how much of the gain you keep.
A stop caps your plan, not your loss
This is the rule most new traders learn the expensive way. A stop fires on the first trade at or through your level, and you get whatever the book offers after that. On a thin small cap that can be several levels lower.
Extreme days show how far. On May 6, 2010, according to the joint CFTC and SEC staff report on the flash crash, over 20,000 trades across more than 300 securities executed at prices more than 60% away from their values just moments before. The same report describes retail stop-loss and market orders that were followed down until they reached unrealistically low bids.
Halts are the everyday version for small caps. Under the Limit Up-Limit Down plan, a Tier 2 stock above $3.00 has a 10% price band, and one priced from $0.75 to $3.00 has 20%. If the price sits at the band for 15 seconds, trading pauses for five minutes, as FINRA's guide to market volatility guardrails describes. No stop can fire while the stock is paused, and it reopens wherever the auction prices it.
So size for the bad fill. Our rule: a stop filling two or three times worse than planned must still be a loss you can take without changing how you trade the next day.
Manage the winners too
Risk management is usually framed around losers, but the biggest leak in many traders' results is on the other side: winners cut short, and losers held on the hope they come back.
Terrance Odean measured this in 10,000 accounts at a discount brokerage from 1987 to 1993. Investors realized 14.8% of the gains available to them and only 9.8% of the losses, so a stock that was up was more than 50 percent more likely to be sold on a given day than one that was down (Journal of Finance, 1998). Those were investors, not scalpers, but the pull is the same at 09:45 on a small cap: take the quick 10 cents, hold the loser one more minute.
In this short lecture from his Making Smart Financial Decisions course, Odean explains the disposition effect himself, including a study of every investor in Taiwan where a winner was about four times as likely to be sold as a loser.

Two numbers keep this honest:
- Expectancy, your average result per trade in R: win rate x average win - loss rate x average loss (glossary: expectancy). At 40% wins of +2R and 60% losses of -1R, expectancy is 0.4 x 2 - 0.6 x 1 = +0.2R a trade, before costs.
- Breakeven win rate for a given reward: 1 / (1 + reward in R). With 2R winners you need to win more than 33.3% of the time; with 1R winners, more than 50%.
Risk reward ratio in day trading has the full table and how costs move it. The practical rules: let the stop or a planned target decide the exit, not the feeling of a green number, and only lift the stop by rules you set before the trade.
Daily loss limit: the rule that saves the account
A daily loss limit stops you after a set loss, for the rest of the day. It matters because losses change behavior. Joshua Coval and Tyler Shumway studied proprietary traders on the Chicago Board of Trade and found them highly loss-averse, regularly assuming above-average afternoon risk to recover from morning losses (Journal of Finance, 2005). Professionals with years of practice did it. You will too.
Set the limit as a multiple of 1R: 3R to 4R is a common range. With $125 risk per trade, a $375 to $500 limit stops you after three or four full losers. It should be small enough that hitting it never changes how you trade tomorrow, and it has to be enforced by something other than willpower: a platform lock, a rule with a trading partner, or closing the platform. Max daily loss covers how to size and enforce it.
Add a weekly line too. If you lose 2 or 3 daily limits in one week, stop trading live, go back to paper and review your journal before the next session.
Exposure caps: per order, per stock, per day
Risk sizing has a blind spot: a very tight stop asks for a very large share count. $125 at a 3 cent stop is 4,166 shares; on a $9 stock that is $37,494, and if the stop fills 10 cents worse, you lose about $542, not $125. Three caps close the gap:
- Per order. No single buy above a fixed dollar value, a little over your largest normal order. This is the classic fat-finger check.
- Per stock. No position above the size you could sell into the bid in a few seconds. On a thin small cap with 300 to 500 shares on each bid level, that may be well under what your buying power allows.
- Buying power. Under Regulation T, the initial margin for a stock purchase is 50 percent of its value, and your broker can require more. Margin raises the most you can buy, not the most you should. Since FINRA's intraday margin rule replaced the pattern day trader rule on June 4, 2026, the old three-trade brake on small margin accounts is gone (what changed on IBKR), so these caps matter more than they did.
Correlated positions count as one. Three small caps running on the same sector headline will fall together, so three 1R trades open at once are closer to one 3R trade.
Costs are part of the risk
Commissions and fees come off every trade, winners and losers, and they grow with share count, not with risk. At Interactive Brokers, IBKR Pro Tiered starts at USD 0.0035 a share with a USD 0.35 minimum, capped at 1% of trade value, plus exchange, clearing and regulatory fees; Fixed is USD 0.005 a share with a USD 1.00 minimum. Checked on October 22, 2026.
On the 480-share ABCD trade, Tiered commission is $1.68 each way, $3.36 for the round trip before fees: under 3% of a $125 R. On the 4,166-share tight-stop trade it is $14.58 each way, $29.16 round trip, over 23% of R before a cent of slippage. Tight stops do not just raise the chance of a bad fill; they raise the cost of every trade.
Your risk plan on one card
Write it down before the open, and keep it where you can see it:
| Item | Example for a $25,000 account |
|---|---|
| 1R | $125 (0.5%) |
| Stop | Under the level that proves the idea wrong; never widened after entry |
| Size | Shares = $125 / stop distance, rounded down |
| Max order | $15,000 |
| Max position in one stock | $20,000, or what the bid can absorb, whichever is smaller |
| Daily loss limit | $400 (3.2R), then flat and done |
| Weekly line | Two daily limits hit: back to paper |
| Pre-market | Limit orders only; a stop must be a stop-limit with outside RTH set, or watched another way |
| Bad fill test | A 3R loss on any one trade is survivable |
The numbers are an example, not advice. The point is that each line is decided with a clear head, before the first trade, and checked against a journal afterwards.
Every post on stops and risk
This cluster covers each rule in depth. The stops and risk hub lists them all; here is what each one covers.
- Position sizing for day trading: the shares formula, rounding, and the caps from buying power and liquidity.
- Where to put your stop loss: structure stops, volatility stops and max-loss stops, and why you never widen one.
- Stop-limit vs stop-market orders: fill or price, and what each does in a gap, a halt and the pre-market.
- Trailing stops for day trading: cents, percent, ATR or structure, and how much each gives back.
- Risk reward ratio: expectancy, breakeven win rates, and why win rate matters too.
- Max daily loss: sizing a daily loss limit in R and enforcing it.
- ATR stops and ATR position sizing: Wilder's average true range on 1-minute bars.
- Bracket orders on IBKR: stop and target attached to the entry in TWS.
- When to move your stop to break-even: the trade-off between protection and scratched winners.
- Why your stop loss did not trigger in the pre-market: outside RTH, stop-limits and the IBKR settings that help.
For what the research says about who makes money, see day trading statistics.
Where Scalpel fits
Scalpel is a keyboard-first desktop cockpit for your own IBKR account, built for long-only scalping of US small caps. It turns most of the plan above into settings, so the rules hold when the tape is moving. This short video walks through its risk controls:
- Fixed risk per trade. The Risk (Cents), Risk (ATR) and Risk (Low) buy presets take dollars of risk and work out the shares from the stop the instant you press, rounded down (sizing presets).
- A stop on every entry. Each fill arms a working stop, a wider catastrophe net and a take-profit at 2R by default, with the dollars and R of each level on the chart (how stops work).
- A daily loss limit that locks. Daily loss ($) in Settings > Risk blocks every new buy once the day's realized plus open P&L reaches it, and can flatten you too. Sells and stops keep working (daily loss limit).
- Caps on every buy. Fat-finger ($) and Max position ($) refuse an oversized order outright rather than shrink it (fat-finger and position caps).
Two limits, plainly. Scalpel's stops are app-monitored, not orders resting at IBKR: when price trades through your stop, Scalpel sends a sell limit 5 cents under the last trade, flagged for extended hours, and re-prices it if the market runs away. They only work while Scalpel is running and connected with a live feed, and no fill is guaranteed. And Scalpel never trades for you; the rules only help if you set them. Practice them in SIM first.
Trading carries a significant risk of loss. Nothing here is financial advice.
Questions
- What is risk management in day trading?
- A set of rules fixed before you trade: a fixed dollar risk per trade, a share count worked out from the stop, a daily loss limit, and caps on order and position size. It limits how much a losing streak, a gap or a mistake can cost you.
- How much should I risk per trade when day trading?
- Many traders risk 0.5% to 1% of the account per trade, and less while learning. At 1%, ten straight losers cost about 9.6% of the account; at 5% they cost about 40%.
- What is the 1% rule in day trading?
- Never lose more than 1% of the account on one trade. It is a cap on the loss at the stop, not on the position size: a $25,000 account risks $250, and the stop distance decides how many shares that buys.
- How do you calculate position size from a stop loss?
- Divide the dollars you are willing to lose by the distance from entry to stop, and round down. Risking $125 with a 26 cent stop is 480 shares.
- What is a good daily loss limit for day trading?
- A common range is 3 to 4 times your risk per trade. With $125 per trade, that is $375 to $500. Once you hit it, stop trading for the day.
- Does a stop loss guarantee my maximum loss?
- No. A stop sends an order once price trades through it, and the fill can be well below the stop in a gap, a fast drop or after a halt. Size every trade so a fill two or three times worse than planned is still survivable.
Related guides
Guide 4.2Trade a fixed dollar risk with Risk (Cents)Risk the same dollars on every scalp: Scalpel works out the shares from your stop as you press. Set Risk (Cents), size your buttons and nudge the stop.Guide 7.1Set a daily loss limit (the kill-switch)Set a max daily loss in Scalpel: when your P&L hits it, new entries stop, a RISK LOCK banner shows, and it can flatten everything. How to resume trading.Guide 5.4R multiples: how Scalpel measures a tradeWhat R is, how Scalpel shows P&L in R on the chart and in the orders panel, how take-profit at N x R works, and why R makes trades on any stock comparable.
Keep reading
- Why your stop loss did not trigger in the pre-market on IBKRIBKR stop loss pre-market: why a plain stop does nothing before 09:30, how a stop-limit gets jumped in a thin book, and the TWS settings that help.
- Position sizing for day trading: size every trade by riskPosition sizing for day trading: shares = dollar risk / stop distance. Worked examples, caps from buying power and liquidity, and fees in the size.
- Stop loss placement: where to put your stop when day tradingStop loss placement for day trading: under the pullback low, VWAP or a round number, sized to your risk. A worked example, and why never to widen.
Practice in SIM, against the live book.A lifetime license, every update included, with a 7-day refund guarantee.Ask in DiscordGet Scalpel