Risk reward ratio in day trading, and why win rate matters too
By Scalpel Team. , updated . 7 min read.
In short
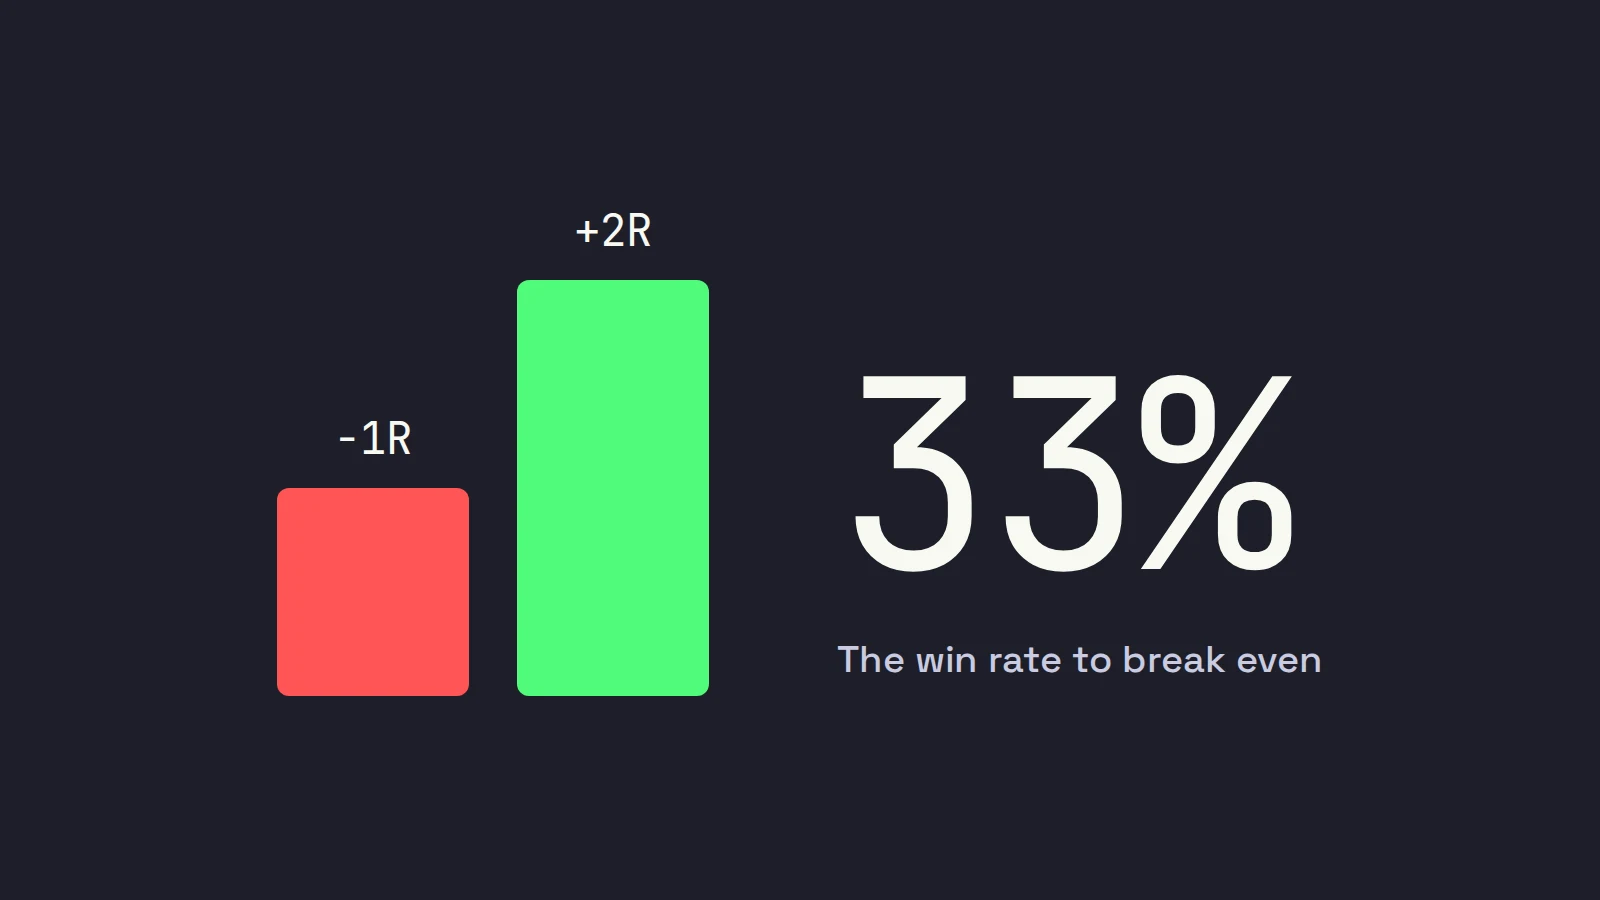
A risk reward ratio compares what a trade can make at its target with what it loses at its stop: risk 12 cents to make 24 and the ratio is 1:2. On its own it tells you nothing about profit. What matters is expectancy, which joins the ratio to your win rate: at 1:2 you break even winning 33.3% of trades before costs, and closer to 39% once commissions, fees and stop slippage are counted. A higher ratio lowers the win rate you need, but a farther target is also hit less often.
The risk reward ratio is the first number most day traders learn and the one most often misused. "Only take 1:3 trades" sounds like an edge. It is not. A ratio is half of an equation, and the other half, how often the trade actually reaches its target, decides whether you make money. This post works through the math with tables, including the costs that most risk reward calculators leave out.
Scalpel is independent and not affiliated with or endorsed by Interactive Brokers. Fees in this post were checked on October 22, 2026.
What the risk reward ratio measures
Risk is the distance from your entry to your stop. Reward is the distance from your entry to your target. Our example trade, used through the whole post: 400 shares of ABCD bought at 5.50, stop at 5.38, target at 5.74.
| Per share | On 400 shares | In R | |
|---|---|---|---|
| Risk (entry to stop) | 0.12 | $48 | 1R |
| Reward (entry to target) | 0.24 | $96 | 2R |
| Risk reward ratio | 1:2 |
Traders write it either way round, 1:2 or 2:1, which causes endless confusion. We write risk first and measure everything in R multiples, where 1R is the dollar risk to your stop. A 1:2 trade is a trade with a +2R target. Thinking in R makes trades comparable: +2R means the same thing on a $3 stock with 1,000 shares as on a $12 stock with 150.
Risk reward ratio and win rate: the break-even table
If every winner pays the target and every loser pays the stop, the win rate you need to break even is:
Break-even win rate = risk / (risk + reward) = 1 / (1 + reward in R)
| Risk reward ratio | Target | Break-even win rate |
|---|---|---|
| 1:0.5 | +0.5R | 66.7% |
| 1:1 | +1R | 50.0% |
| 1:1.5 | +1.5R | 40.0% |
| 1:2 | +2R | 33.3% |
| 1:3 | +3R | 25.0% |
This is where the popular advice comes from: at 1:3 you can be wrong three times out of four and still not lose money. True, as far as it goes. The problem is the next question.
Win rate vs risk reward: why a bigger ratio is not free
A target twice as far away is not reached as often. Push the target from +1R to +3R and your win rate falls, because the stock has to travel three times as far before it touches your stop.
There is a clean way to see how much. If price moved as a pure random walk, with no edge at all, the chance of reaching +2R before -1R is exactly 1 in 3. That is the classic gambler's ruin result: the chance of hitting the upper level first is the distance to the lower level divided by the total distance between them. Plug that into the table and every ratio has an expectancy of exactly zero:
| Target | Chance of hitting it first, no edge | Expectancy before costs |
|---|---|---|
| +1R | 50.0% | 0.5 x 1 - 0.5 x 1 = 0R |
| +2R | 33.3% | 0.333 x 2 - 0.667 x 1 = 0R |
| +3R | 25.0% | 0.25 x 3 - 0.75 x 1 = 0R |
Read that twice. In a market with no edge, the ratio you pick only changes how your results are spread out, many small wins or a few big ones. It never makes the sum positive. A risk reward ratio becomes worth something only when your entry gives the stock a better than random chance of reaching the target first. That edge comes from the setup, the tape and the level you trade against, not from where you put the target.
Expectancy in trading: the number that decides
Expectancy is what an average trade is worth:
Expectancy (R) = win rate x average win (R) - loss rate x average loss (R)
A hypothetical trader who wins 45% of trades at +2R and loses 55% at -1R has an expectancy of 0.45 x 2 - 0.55 x 1 = +0.35R per trade, before costs. At $48 a trade that would be about $16.80 per trade on average. The same trader at a 30% win rate has 0.30 x 2 - 0.70 x 1 = -0.10R: a losing system, with the same "good" 1:2 ratio.
That is why Scalpel's Analytics, and any decent trading journal, puts expectancy in R next to win rate and payoff ratio (average win divided by average loss). The ratio you planned is an intention. Your payoff ratio is what actually happened, after you moved targets, cut winners early and let stops slip.
The risk reward ratio after costs
The break-even table assumes winners and losers cost nothing to trade. They do, and costs bite hardest on small targets.
Take the ABCD trade on IBKR Pro Tiered pricing. Interactive Brokers charges $0.0035 a share with a $0.35 minimum up to 300,000 shares a month, and the same page lists $0.0002 a share in clearing fees. The SEC's Section 31 fee on sales is $20.60 per million dollars from April 4, 2026. For 400 shares in and out:
| Cost | Amount |
|---|---|
| Commission, 400 x $0.0035, both sides | $2.80 |
| Clearing, 400 x $0.0002, both sides | $0.16 |
| SEC fee on a $2,296 sale | $0.05 |
| Round trip, before exchange fees | about $3.01 |
Exchange fees on Tiered vary by venue and by whether you add or take liquidity, so treat $3 as a floor. Then add slippage on the stop. A stop exit in a fast small cap rarely fills at the stop price; the disclosure under IBKR's order type lessons says orders "guarantee a fill or guarantee a price, but not both." Assume the stop exit averages 2 cents worse than planned, $8 on 400 shares.
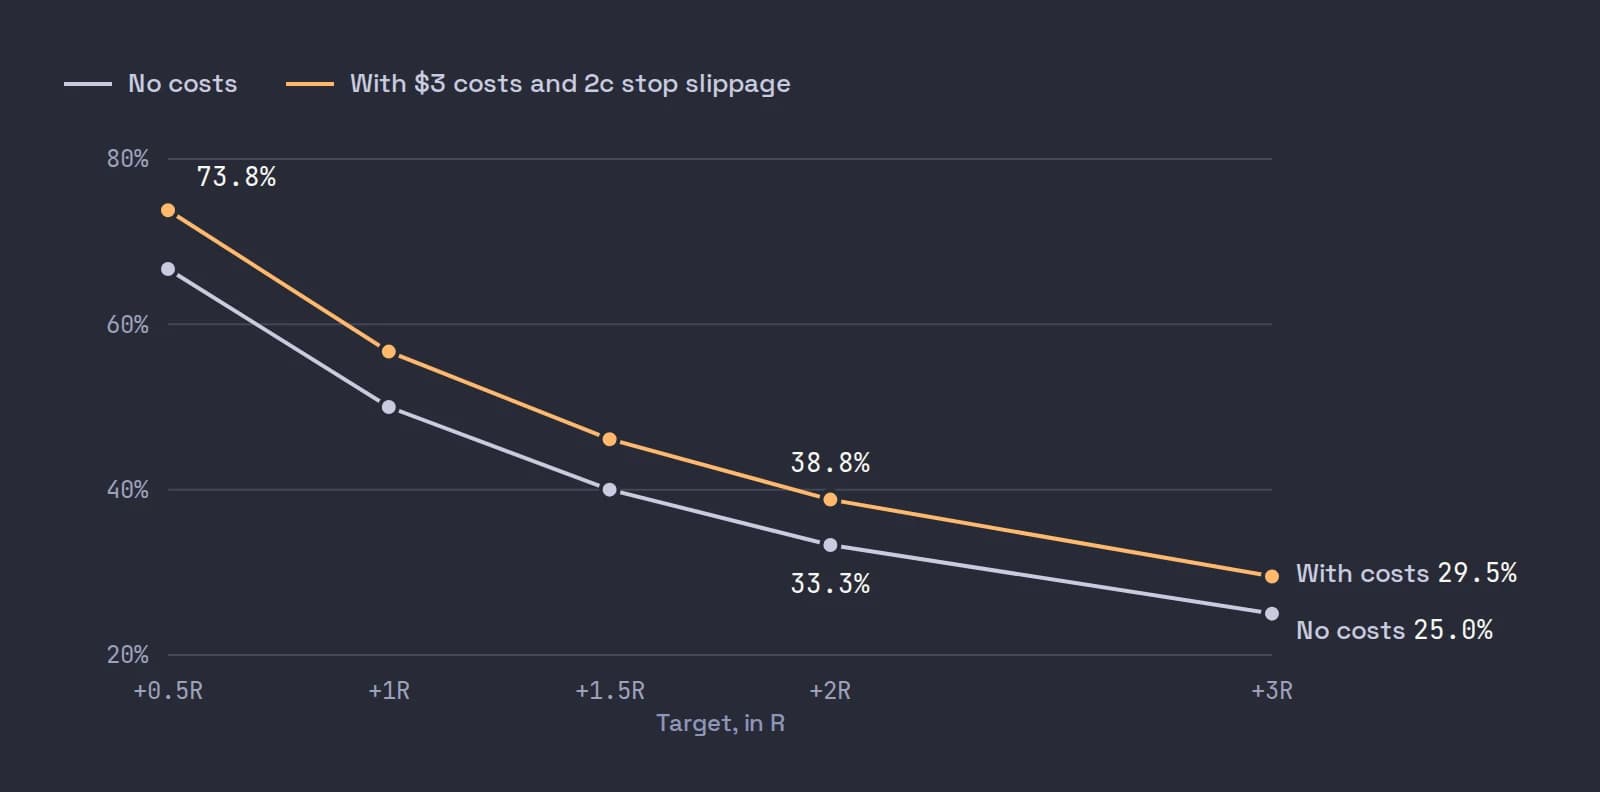
Now a +2R winner nets $96 - $3 = $93, and a stop-out costs $48 + $3 + $8 = $59. The break-even win rate becomes 59 / (93 + 59) = 38.8%, not 33.3%.
| Target | Win nets | Loss costs | Break-even, no costs | Break-even, with costs |
|---|---|---|---|---|
| +0.5R | $21 | $59 | 66.7% | 73.8% |
| +1R | $45 | $59 | 50.0% | 56.7% |
| +1.5R | $69 | $59 | 40.0% | 46.1% |
| +2R | $93 | $59 | 33.3% | 38.8% |
| +3R | $141 | $59 | 25.0% | 29.5% |
Two lessons sit in that table. Costs add 4 to 7 points to the hurdle at every ratio. And a scalp for half an R is a very different business from one for 2R: you have to be right three times in four just to stand still. The hypothetical 45% trader above drops from +0.35R to about +0.20R once costs are in (0.45 x 1.94 - 0.55 x 1.23). For the full cost picture, see the real cost of day trading and commissions on IBKR.
What the research says about win rates
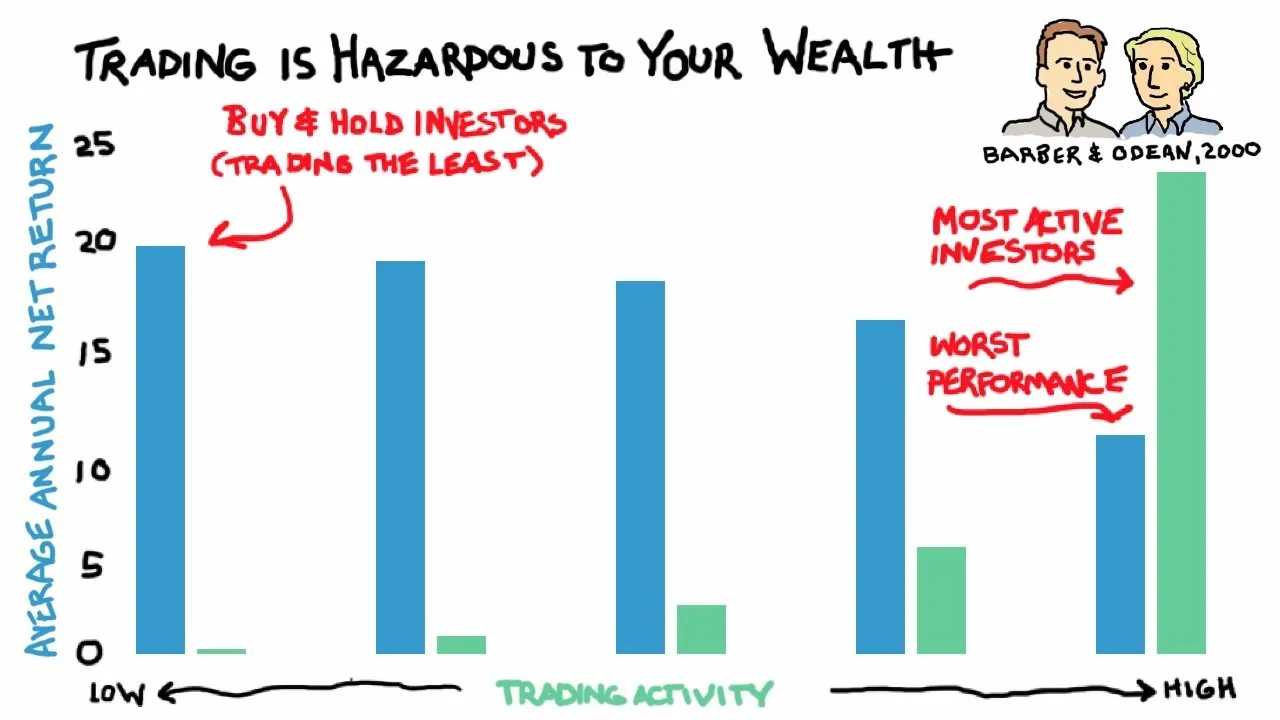
Most day traders never find the edge that makes any ratio work. In the largest study of its kind, Barber, Lee, Liu and Odean followed Taiwan's day traders from 1992 to 2006 and found that less than 1% of the day trader population could predictably earn positive returns after fees (Journal of Financial Markets, 2014). Fees mattered: the bottom-ranked traders went from -11.5 basis points a day before fees to -28.9 after. A study of Brazil's futures market by Chague, De-Losso and Giovannetti found that 97% of individuals who day traded for 300 days or more lost money (University of Sao Paulo working paper, 2019). More of the research is collected in day trading statistics.
None of that makes a ratio useless. It means the honest way to use one is to measure it, not to assume it.
Terrance Odean, a co-author of the Taiwan study, explains in this lecture from his Making Smart Financial Decisions course why overconfident traders trade more and earn less, and why the most active accounts in his data trailed buy-and-hold accounts after costs.
How to use the risk reward ratio in practice
- Set the stop first, from the chart. The stop goes where the trade is wrong, under a level that matters (stop loss placement). Never shrink a stop to make the ratio look better.
- Size from the stop. Fixed dollar risk per trade keeps 1R constant, so your R statistics mean something (position sizing for day trading, trade a fixed dollar risk).
- Pick a target the chart can pay. If the next resistance is 15 cents away, a 36-cent target is a hope, not a 1:3 trade.
- Skip trades where the costs eat the target. If the target nets less than about 1R after costs, the hurdle is steep.
- Track realized R, not planned R. After 100 trades, compare your average win and loss in R with what you planned. The gap is usually where the money went.
- Count the stop slippage. Losers that average -1.2R instead of -1R move your break-even win rate by several points, as the table shows.
Where you take profits also changes the math: scaling out at +1R and moving the stop up is a different payoff shape from one fixed target. We cover that in when to move your stop to break-even. For the wider set of rules, see the pillar on day trading risk management, and for the limit that caps a bad day, max daily loss.
Where Scalpel fits
Scalpel measures every trade in R by design. Each entry arms a working stop and a take-profit at Take profit (R) times your stop distance, 2R by default, and the chart chips show what each level would realize in dollars and R before you commit (how stops work). Its stops and targets are app-monitored, not resting orders at IBKR: they only work while Scalpel runs with a live feed, and in LIVE a stop exit is a sell limit 5 cents under the last trade, so it can fill below your stop.
The Analytics view then shows what you actually did: win rate, expectancy in R, payoff, profit factor and an R distribution of every closed trade, all net of fees (analytics). If your losers cluster in the -2R buckets, your real ratio is worse than your planned one, and the table above tells you what that costs.
The video above shows Scalpel's risk controls: the daily loss limit and the per-order caps that sit beside your per-trade R.
Trading carries a significant risk of loss. Nothing here is financial advice.
Questions
- What is a good risk reward ratio for day trading?
- There is no good ratio on its own. A ratio only works together with your win rate. At 1:2 you need to win about 33% of trades before costs and closer to 39% after commissions, fees and stop slippage. Pick the target the chart can pay, then measure whether you hit it often enough.
- How do you calculate the risk reward ratio?
- Divide the distance from entry to target by the distance from entry to stop. Buy at 5.50 with a stop at 5.38 and a target at 5.74: you risk 12 cents to make 24, a ratio of 1:2.
- What win rate do I need with a 1:3 risk reward ratio?
- 25% to break even before costs. With typical commissions, fees and a little slippage on stops, the hurdle rises to about 29 to 30% on a small-cap scalp.
- Is win rate or risk reward more important?
- Neither alone. Expectancy combines them: win rate times average win minus loss rate times average loss. A 30% win rate at 1:2 loses money, and a 60% win rate at 1:1 makes money before costs.
- What is expectancy in trading?
- The average result per trade, usually in R. A positive expectancy over hundreds of trades is the only sign a strategy works. Scalpel's Analytics calculates it from your closed trades, net of fees.
Related guides
Guide 5.4R multiples: how Scalpel measures a tradeWhat R is, how Scalpel shows P&L in R on the chart and in the orders panel, how take-profit at N x R works, and why R makes trades on any stock comparable.Guide 6.4Analytics: review your tradingScalpel's Analytics view: equity curve, win rate, expectancy, profit factor, R distribution, every trade, results by symbol and hour, and a trader grade.Guide 4.2Trade a fixed dollar risk with Risk (Cents)Risk the same dollars on every scalp: Scalpel works out the shares from your stop as you press. Set Risk (Cents), size your buttons and nudge the stop.
Keep reading
- Day trading risk management: the rules that keep you tradingDay trading risk management in five rules: fixed risk per trade, sizing from the stop, a daily loss limit, exposure caps and the math of drawdowns.
- Why your stop loss did not trigger in the pre-market on IBKRIBKR stop loss pre-market: why a plain stop does nothing before 09:30, how a stop-limit gets jumped in a thin book, and the TWS settings that help.
- Position sizing for day trading: size every trade by riskPosition sizing for day trading: shares = dollar risk / stop distance. Worked examples, caps from buying power and liquidity, and fees in the size.
Practice in SIM, against the live book.A lifetime license, every update included, with a 7-day refund guarantee.Ask in DiscordGet Scalpel