ATR stop loss and ATR position sizing for day traders
By Scalpel Team. , updated . 7 min read.
In short
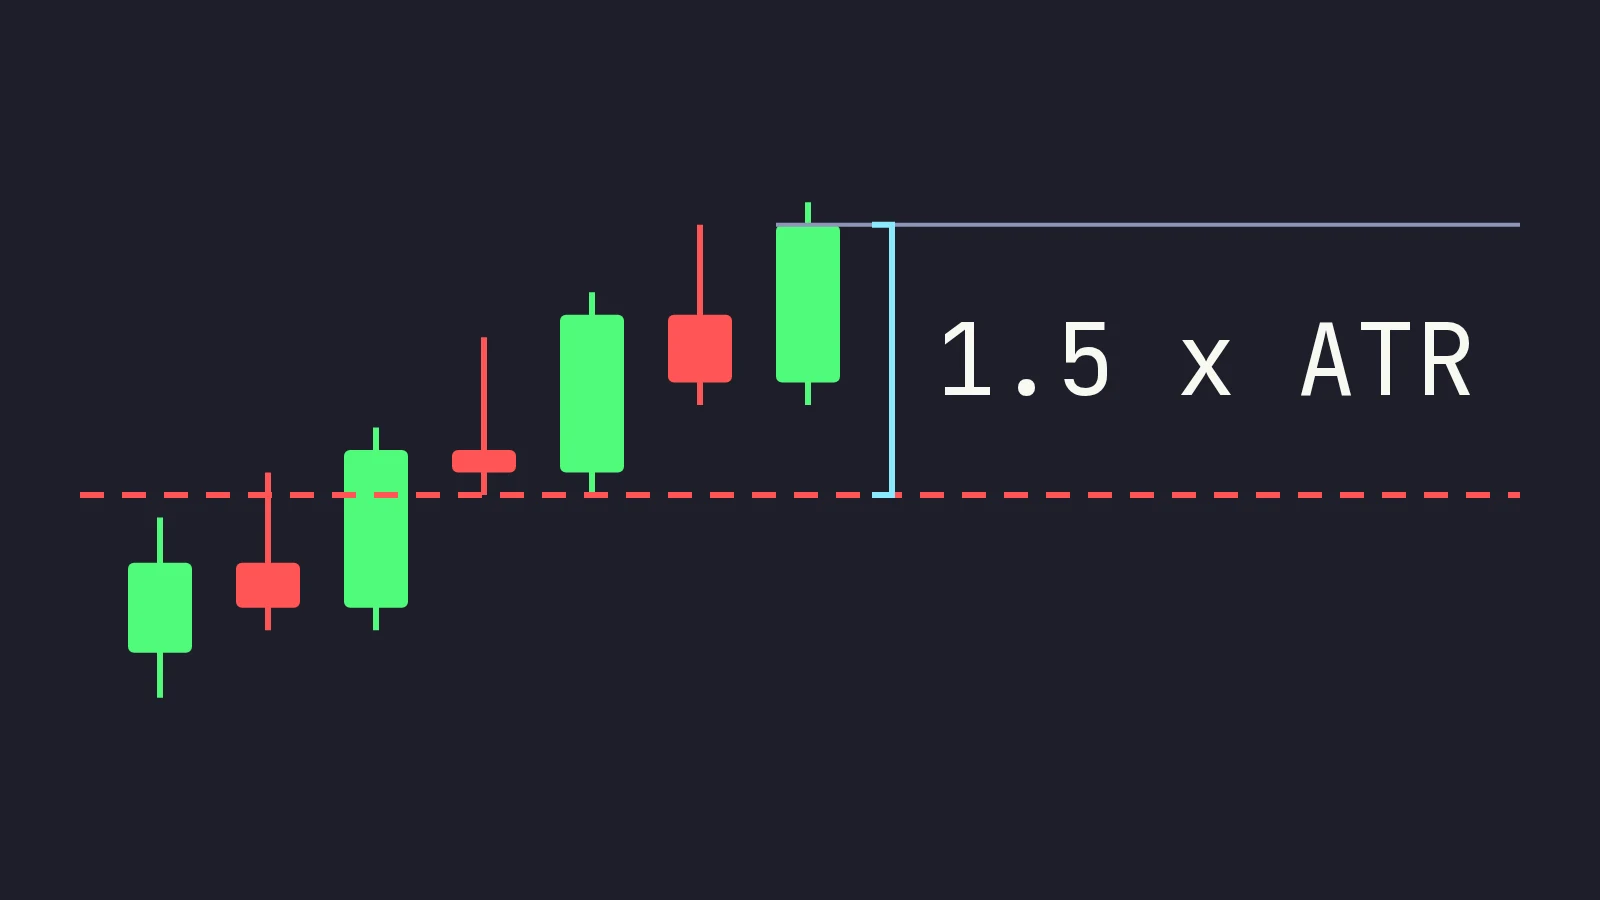
An ATR stop loss puts your stop a multiple of the average true range under your entry: with a 1-minute ATR of 8 cents and a 1.5 multiple, the stop sits 12 cents under. ATR position sizing then divides your dollar risk by that distance: $100 of risk at a 12-cent stop buys 833 shares. The stop widens on jumpy stocks and tightens on quiet ones, so normal noise is less likely to stop you out, and the dollar loss at the stop stays the same on every trade.
A fixed 20-cent stop is tight on one stock and loose on the next. The average true range fixes that by measuring how far each stock actually moves per bar and setting the stop from it. This post walks through J. Welles Wilder's ATR formula with real numbers, how to use it on 1-minute bars, which multiple to use, and how ATR sizing keeps your risk constant. We build Scalpel's stops on exactly this method, so we will also say where it fails.
Scalpel is independent and not affiliated with or endorsed by Interactive Brokers.
What the average true range measures
ATR is a volatility measure in price units: on a 1-minute chart, "ATR 0.08" means the stock has typically covered 8 cents per minute recently. It says nothing about direction. Wilder introduced it in his 1978 book New Concepts in Technical Trading Systems, originally for commodities, and recommended a 14-period average.
The key word is "true." A bar's plain range, high minus low, misses gaps. If ABCD closes one minute at 5.60 and the next minute trades 5.70 to 5.78, the bar's range is 8 cents, but the stock really moved 18 cents from the last close. True range counts that gap.
Wilder's ATR formula, worked
True range is the largest of three numbers:
- High minus low
- The absolute value of high minus the previous close
- The absolute value of low minus the previous close
Three 1-minute bars on ABCD, one of each kind:
| Bar | Previous close | High | Low | High - low | High - prev close | Low - prev close | True range |
|---|---|---|---|---|---|---|---|
| Inside | 5.62 | 5.66 | 5.58 | 0.08 | 0.04 | 0.04 | 0.08 |
| Gap up | 5.60 | 5.78 | 5.70 | 0.08 | 0.18 | 0.10 | 0.18 |
| Gap down | 5.70 | 5.62 | 5.55 | 0.07 | 0.08 | 0.15 | 0.15 |
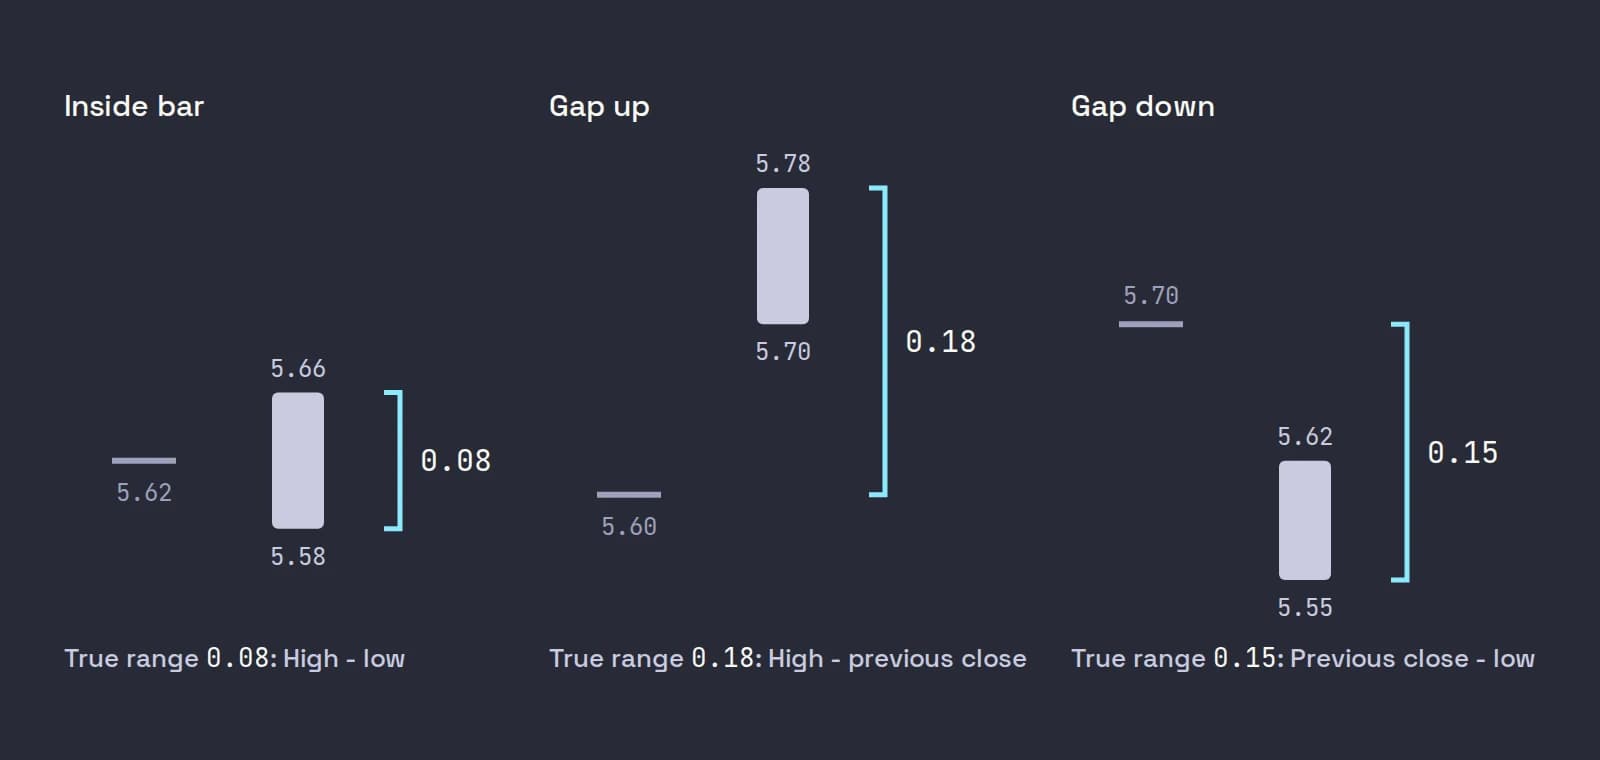
The first ATR is the simple average of the first 14 true ranges. So you need 15 bars: 14 true ranges, each with the close before it.
Every ATR after that is Wilder's smoothing:
ATR now = (previous ATR x 13 + today's true range) / 14
Worked through: the 1-minute ATR is 0.080, and the next bar has a true range of 0.150, a burst of selling. The new ATR is (0.080 x 13 + 0.150) / 14 = 1.19 / 14 = 0.085. One wild bar moves ATR by half a cent, not 7 cents. That smoothing is the point: ATR follows a stock that is waking up, but one print does not throw your stop around.
Intraday ATR on 1-minute bars
Wilder used daily bars. A daily ATR is useless for a scalp: a stock with a 60-cent daily ATR might move 5 cents a minute. For day trading, compute ATR on the timeframe you trade.
| Timeframe | Suits | Watch out for |
|---|---|---|
| 10-second bars | Very tight scalps on liquid names | Noisy; one print swings the bar |
| 1-minute bars | Most small-cap momentum scalps | Needs 15 minutes of bars before it is valid |
| 5-minute bars | Slower holds and wider stops | Reacts slowly to a stock that just woke up |
Three intraday traps:
- The first minutes. With fewer than 15 bars there is no proper 14-period ATR yet. Use a fixed fallback stop until there is.
- Pre-market gaps between bars. In a thin pre-market, minutes can pass with no trades, and the next bar's true range includes the jump from the last close. That is real risk, so keep it.
- The open. ATR measured at 09:25 understates 09:31. Expect stops sized from pre-market bars to be tight for the first minutes of the session.
ATR stop loss: which multiple to use
The stop sits multiple x ATR under your entry. The multiple decides how much noise you tolerate.
| Multiple | Stop with ATR 0.08 | What it means |
|---|---|---|
| 1.0 x | 0.08 | About one normal bar against you. Tight: noise stops you often |
| 1.5 x | 0.12 | A common scalping default. Room for a bar and a half of noise |
| 2.0 x | 0.16 | Wider; fewer noise stop-outs, smaller size |
| 3.0 x | 0.24 | A backstop distance, not a scalping stop |
There is no right multiple, only a trade-off. A tighter multiple gives you more shares and more stop-outs; a wider one gives fewer shares and fewer stop-outs, and changes your risk reward ratio because the target in R moves with the stop. The chart still has the final say: if the level that proves you wrong is 15 cents away, a 12-cent ATR stop sits above it and gets tagged. Put the stop under the level and let the size shrink (stop loss placement).
ATR position sizing
ATR sizing turns the stop distance into a share count so that every stop-out costs the same dollars:
Shares = dollar risk / (multiple x ATR), rounded down.
With $100 of risk on ABCD at a 5.71 ask, ATR 0.08:
| Multiple | Stop distance | Shares | Position size | Loss at the stop |
|---|---|---|---|---|
| 1.0 x | 0.08 | 1,250 | $7,137.50 | $100.00 |
| 1.5 x | 0.12 | 833 | $4,756.43 | $99.96 |
| 2.0 x | 0.16 | 625 | $3,568.75 | $100.00 |
| 3.0 x | 0.24 | 416 | $2,375.36 | $99.84 |
Now a jumpier stock. WXYZ at 12.40 with a 1-minute ATR of 0.22: at 1.5 x the stop is 33 cents, and $100 buys 303 shares, about $3,757. Different stock, different price, different volatility, same $100 at the stop. That is the whole case for position sizing by risk: your losers stay comparable, and your R statistics mean something.
Two checks before you trust the number. A very quiet stock can produce a tiny ATR and a huge share count, so cap the position in dollars. And always look at the size before you press: a share count that surprises you usually means the ATR or the stop is wrong.
The ATR trailing stop
An ATR trailing stop follows the trade up at a distance of a multiple of ATR under the highest price since entry, and never moves down. With a high of 5.95 and an ATR of 0.09, a 2 x ATR trail sits at 5.77. As the high rises, the stop rises.
Two versions are common: recompute the distance from the live ATR (the stop loosens when the stock gets wilder), or fix the distance at entry (predictable, and what most scalpers want). TWS has no ATR trailing order type; its trailing stop takes a fixed trailing amount, so you would compute the ATR distance yourself and type it in. More on trail styles in trailing stops for day trading.
Where ATR stops fail
ATR measures the past. It does not see the next bar.
- Halts. Under the Limit Up-Limit Down plan, most small caps over $3 have price bands 10% either side of a five-minute reference price, and stocks from $0.75 to $3.00 have 20%. If the market cannot trade inside the band for 15 seconds, trading pauses for five minutes. No stop of any kind fills during a pause, and the reopen can be far below your ATR stop. See LULD trading halts.
- Gaps through the stop. A stop is a trigger, not a price. A thin book can fill you well under it.
- Regime changes. A stock that has been quiet for an hour has a small ATR exactly when news is about to hit it.
IBKR's Traders' Academy covers how volatility is measured, including ATR and why it changes, in its volatility lesson; it is worth watching for the reasoning behind any volatility-based stop.

Where Scalpel fits
Scalpel's default stop is an ATR stop. Every entry arms a working stop at 1.5 x the 14-bar ATR on the 1-minute chart, using Wilder's smoothing, and a wider catastrophe net at 3 x ATR. The Risk (ATR) buy preset sizes the order from that stop: shares = your dollar risk / stop distance, worked out from the live ask the instant you press (sizing presets). Change the multiples, the timeframe (10s, 1m or 5m) and the period in Settings > Stops (settings: stops).
Guard rails cover the traps above. Until there is enough candle history, Scalpel uses Stop floor (c), 20 cents or 1% of the price if that is smaller, and the stop never sits more than 40% under the price. An ATR wider than 5% of the price per bar is treated as bad data, and the floor is used instead. The Same as my stop trail follows new highs at the distance you entered with, so an ATR entry trails by its ATR distance fixed at entry (breakeven and trailing stops).
Scalpel's stops are app-monitored, not resting orders at IBKR. They only work while Scalpel runs with a live feed, and in LIVE a stop exit is a sell limit 5 cents under the last trade, re-priced if the market runs away, so no fill price is guaranteed (how stops work).
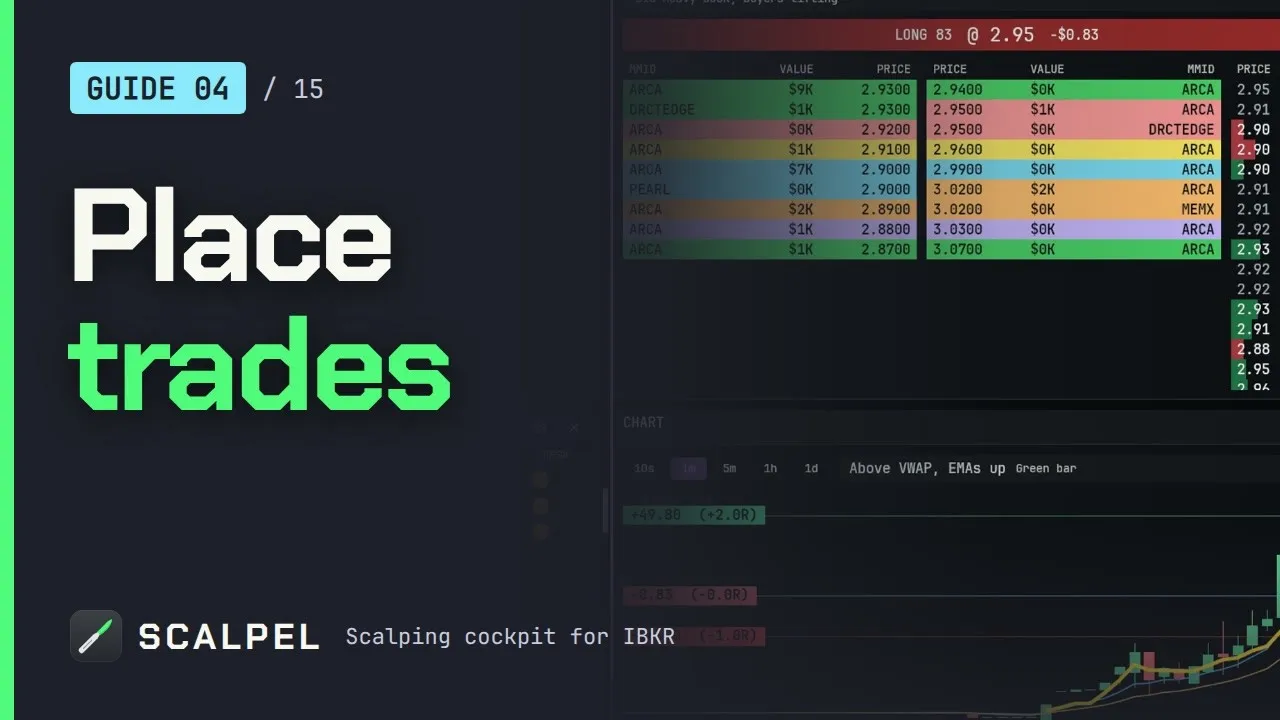
The video above shows the buy presets, including the risk kinds that size from the stop. For the full set of rules around a stop, see the pillar on day trading risk management, and for the term itself, the glossary entry on ATR.
Trading carries a significant risk of loss. Nothing here is financial advice.
Questions
- What is a good ATR multiple for a stop loss?
- For intraday scalps on 1-minute bars, 1 to 2 times ATR is the usual range, and 1.5 is a common default. Tighter means more shares and more noise stop-outs; wider means fewer of both. Check it against the chart level that proves the trade wrong.
- How do you calculate ATR?
- True range is the largest of high minus low, high minus the previous close, and low minus the previous close. The first ATR is the average of 14 true ranges; after that, Wilder's method takes the previous ATR times 13, adds the new true range, and divides by 14.
- How do you use ATR for position sizing?
- Divide your dollar risk by the stop distance in dollars per share. With $100 of risk and a stop of 1.5 times an 8 cent ATR, 12 cents, you buy 833 shares, and a stop-out costs about $100 before slippage and fees.
- What timeframe should I use for ATR in day trading?
- The one you trade. Most small-cap scalpers use 1-minute bars; 10-second bars suit very tight scalps and 5-minute bars slower holds. A daily ATR is far too wide for an intraday stop.
- Is TWS's ATR the same as Wilder's?
- Not exactly. IBKR's TWS guide describes its ATR study as a simple moving average of true ranges, while Wilder smooths each new value into the previous ATR. The results are close but can differ slightly.
Related guides
Guide 4.1Sizing presets: shares, dollars or riskSet Scalpel's four buy presets to a share count, a dollar clip or a dollar risk from an ATR, swing low or cents stop, and see the size each press will buy.Guide 4.2Trade a fixed dollar risk with Risk (Cents)Risk the same dollars on every scalp: Scalpel works out the shares from your stop as you press. Set Risk (Cents), size your buttons and nudge the stop.Guide 11.3Settings: StopsEvery option on Scalpel's Stops tab: ATR multiples and period, stop floors, take-profit R, the Risk (Cents) stop and trailing, with defaults and ranges.
Keep reading
- Day trading risk management: the rules that keep you tradingDay trading risk management in five rules: fixed risk per trade, sizing from the stop, a daily loss limit, exposure caps and the math of drawdowns.
- Why your stop loss did not trigger in the pre-market on IBKRIBKR stop loss pre-market: why a plain stop does nothing before 09:30, how a stop-limit gets jumped in a thin book, and the TWS settings that help.
- Position sizing for day trading: size every trade by riskPosition sizing for day trading: shares = dollar risk / stop distance. Worked examples, caps from buying power and liquidity, and fees in the size.
Practice in SIM, against the live book.A lifetime license, every update included, with a 7-day refund guarantee.Ask in DiscordGet Scalpel