Momentum day trading: how small-cap momentum works
By Scalpel Team. , updated . 13 min read.
In short
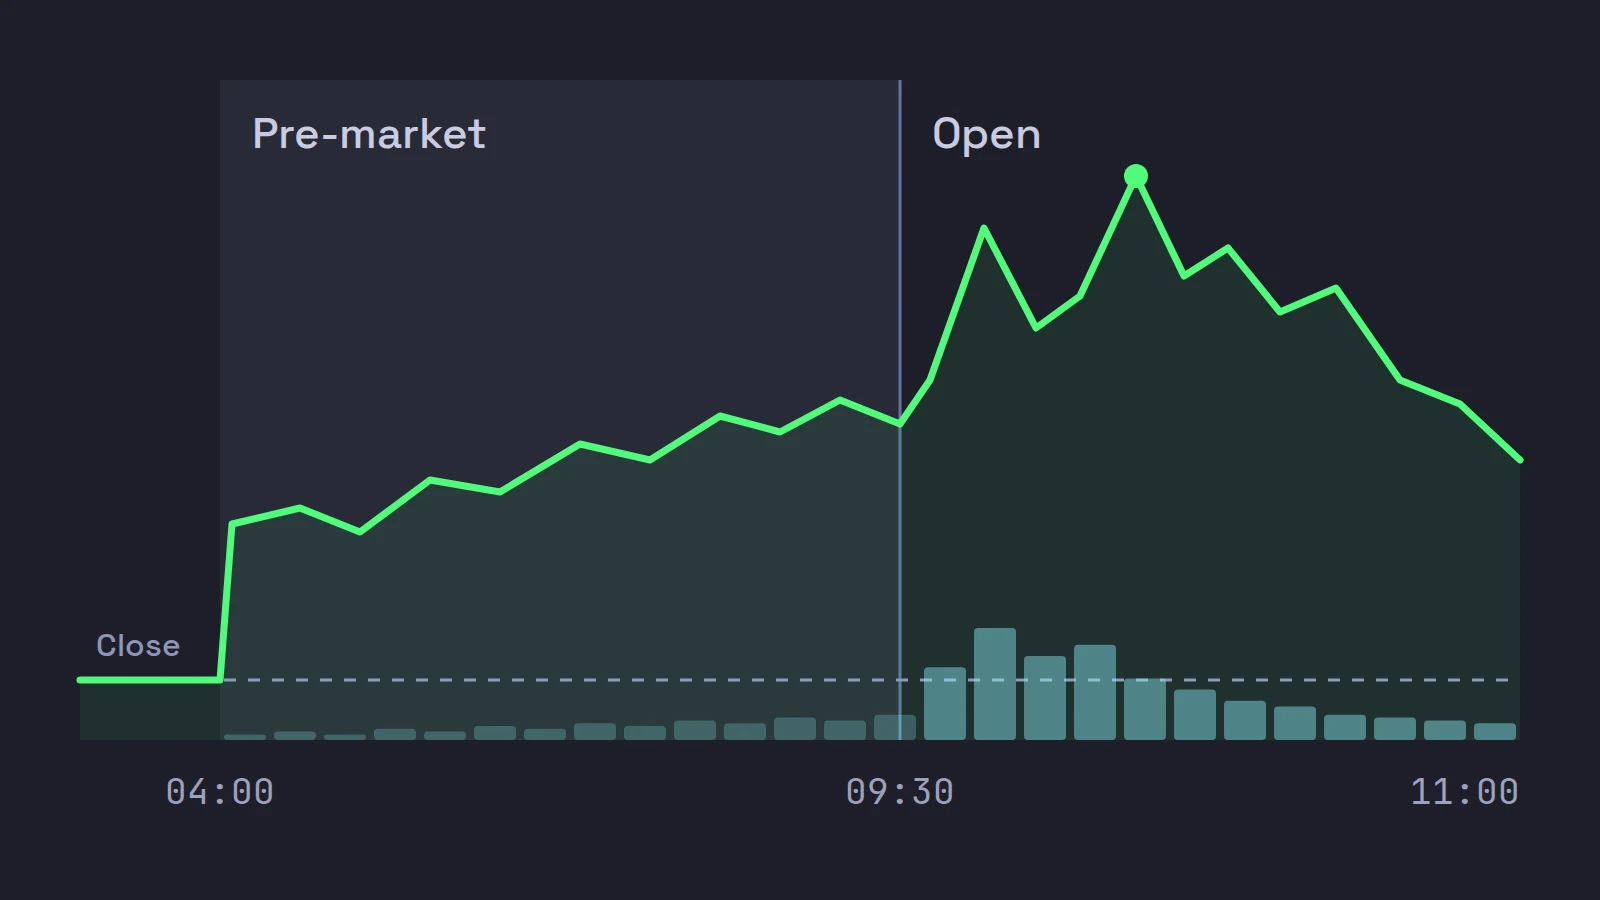
Momentum day trading means buying a stock that is already moving hard, on news and heavy volume, and selling within minutes while the move lasts. In US small caps, traders look for five things: a fresh catalyst, a low float, relative volume of 5x or more, a price of about $2 to $20, and a stock already up 10% or more. They trade it in the pre-market and the first hour, enter on a break of the pre-market high, the high of day or the first pullback, and keep a small fixed risk with a hard daily loss limit. The research is blunt: most people who try it lose money.
Momentum day trading is the style behind most of the "stock up 200% before the open" headlines, and it is the style Scalpel was built around. We build the tool on the Interactive Brokers API and use it every morning, so this guide explains how small-cap momentum actually works: why a stock moves, what the trading day looks like, how traders enter and exit, and what the evidence says about the odds. It is not a pitch. If you finish it and decide this style is not for you, that is a reasonable outcome.
Scalpel is independent and not affiliated with or endorsed by Interactive Brokers.
What momentum day trading is, and what it is not
The word "momentum" means two different things, and mixing them up causes bad decisions.
In academic finance, momentum is a slow effect. Narasimhan Jegadeesh and Sheridan Titman showed that buying past winners and selling past losers earned significant positive returns over three- to twelve-month holding periods (Journal of Finance, 1993). That is a portfolio strategy measured in months, and none of it says anything about a five-minute trade in a $4 stock.
There is intraday research too. Lei Gao, Yufeng Han, Sophia Zhengzi Li and Guofu Zhou found that on the S&P 500 ETF, from 1993 to 2013, the first half-hour's return predicts the last half-hour's (Journal of Financial Economics, 2018), more strongly on volatile and high-volume days. Interesting, but again: an index fund, not a small cap.
Small cap momentum trading is something else. It is attention trading. A company puts out news, the stock gaps, it shows up on every scanner, and a crowd of short-term traders piles in at once. Brad Barber and Terrance Odean showed that individual investors are net buyers of attention-grabbing stocks: stocks in the news, stocks with abnormally high volume, and stocks with extreme one-day returns (Review of Financial Studies, 2008). A momentum day trader is trying to be early in that crowd and out before it turns. Nobody is being paid for patience here; you are being paid, when it works, for being quick and selective in a market full of other people doing the same thing.
Why small caps move: the five ingredients
Most small-cap momentum traders screen for the same five things, whatever book or course they learned from. Each one has a reason, and each one has its own post in this cluster.
| Ingredient | Typical threshold | Why it matters |
|---|---|---|
| A fresh catalyst | News in the last few hours | It gives buyers a reason. Moves without news tend to fade |
| A low float | Often under 10 to 20 million shares | Few shares to trade, so buying moves the price fast |
| High relative volume | 5x normal or more | Far more traders than usual are involved |
| Price | About $2 to $20 | Cheap enough to move a lot in percent, liquid enough to exit |
| Already moving | Up 10% or more on the day | The move is under way, not hoped for |
The catalyst is the first question on any runner. FDA decisions, trial data, contracts and buyouts move small caps; a conference appearance usually does not, and an offering is the company selling stock to you. News catalysts for day trading grades the common headline types and the red flags.
Float is the supply. A stock with 3 million shares available behaves nothing like one with 300 million. Low float stocks explains what float means and why the smallest ones run hardest, and why they also collapse hardest.
Relative volume is how you tell real interest from a stock drifting up on a few hundred shares. Relative volume (RVOL) shows how to compute it, why the time of day changes the reading, and the trap with stocks that barely trade normally.
Price and change are what the scanner filters on directly. The $2 to $20 band is a convention, not a law: below $1 the spread eats you, and above $20 a stock needs far more money to move 10%.
A worked example of the screen, with fictional tickers. At 07:45 ET:
- ABCD is $4.30, up 45% from a $2.97 close, on 2.1 million shares against a 400,000 share daily average (5.3x already), with 4.5 million shares outstanding and a headline about a supply contract at 07:02. It passes all five.
- WXYZ is $6.10, up 22%, on 300,000 shares, with 80 million shares outstanding and no news. It fails float, catalyst and relative volume. It may still go up. It is just not the kind of stock this style is about.
The shape of a momentum day
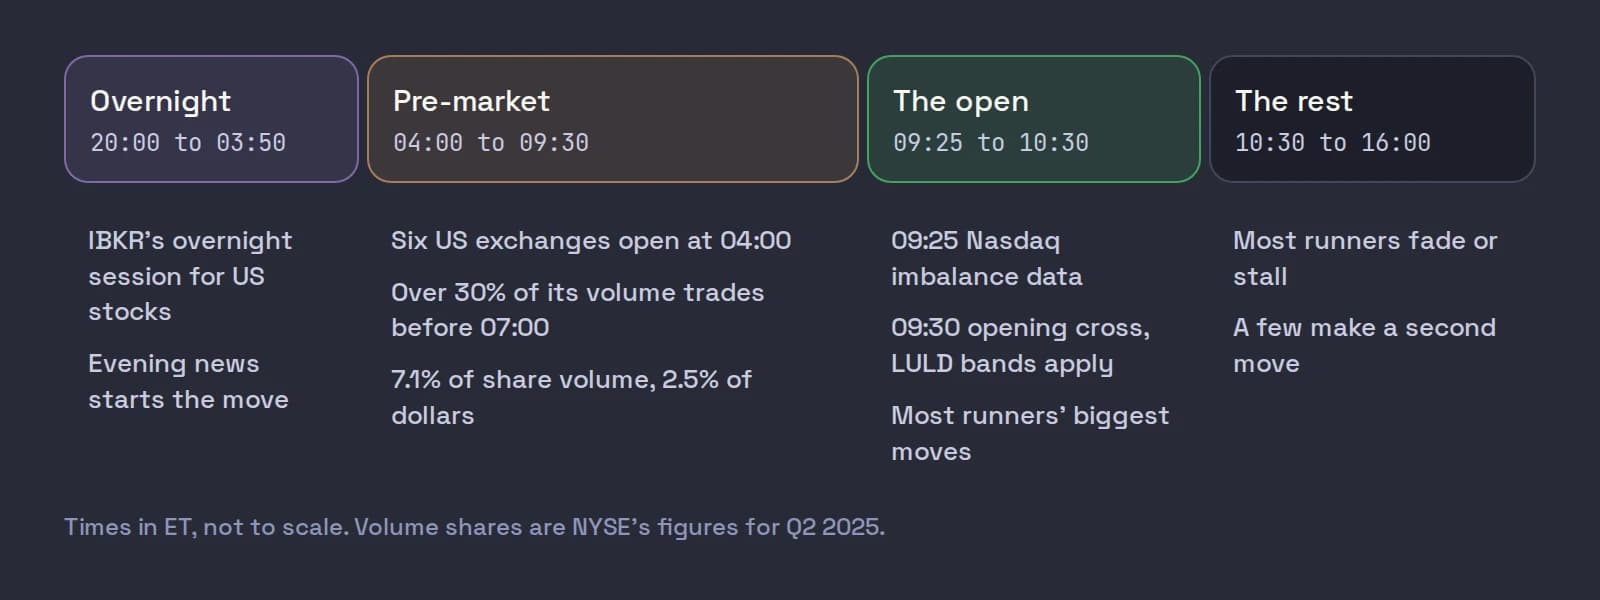
Momentum in small caps is front-loaded. Most of the opportunity, and most of the danger, sits between the early pre-market and the first hour after the open. The best time of day to day trade goes through each window in detail; here is the outline.
| Time (ET) | What happens |
|---|---|
| 20:00 to 03:50 | IBKR's overnight session for US stocks. Evening news can start moving a stock here |
| 04:00 | The pre-market opens. NYSE counts six US equity exchanges open at 4am |
| 04:00 to 09:30 | The gappers appear and build. Books are thin, spreads wide |
| 09:25 to 09:30 | Nasdaq publishes opening imbalance information, then runs the opening cross at 09:30 |
| 09:30 to about 10:30 | The open: the most volume and the biggest moves of the day for most runners |
| Late morning on | Most runners fade or go sideways. A few make a second move |
The pre-market is where a lot of the setup happens, and it is a different market. NYSE's research put the pre-market at 7.1% of all US equity share volume in the second quarter of 2025, but only 2.5% of the dollar value, which tells you how much of that volume is in cheap shares. The same report says almost 8 out of every 10 non-S&P 500 shares traded in NYSE Arca's pre-market session involve a retail trader on one side. The SEC's investor bulletin on extended hours lists what that means in practice: less liquidity, more volatility, wider spreads, and prices that may not hold into the open.
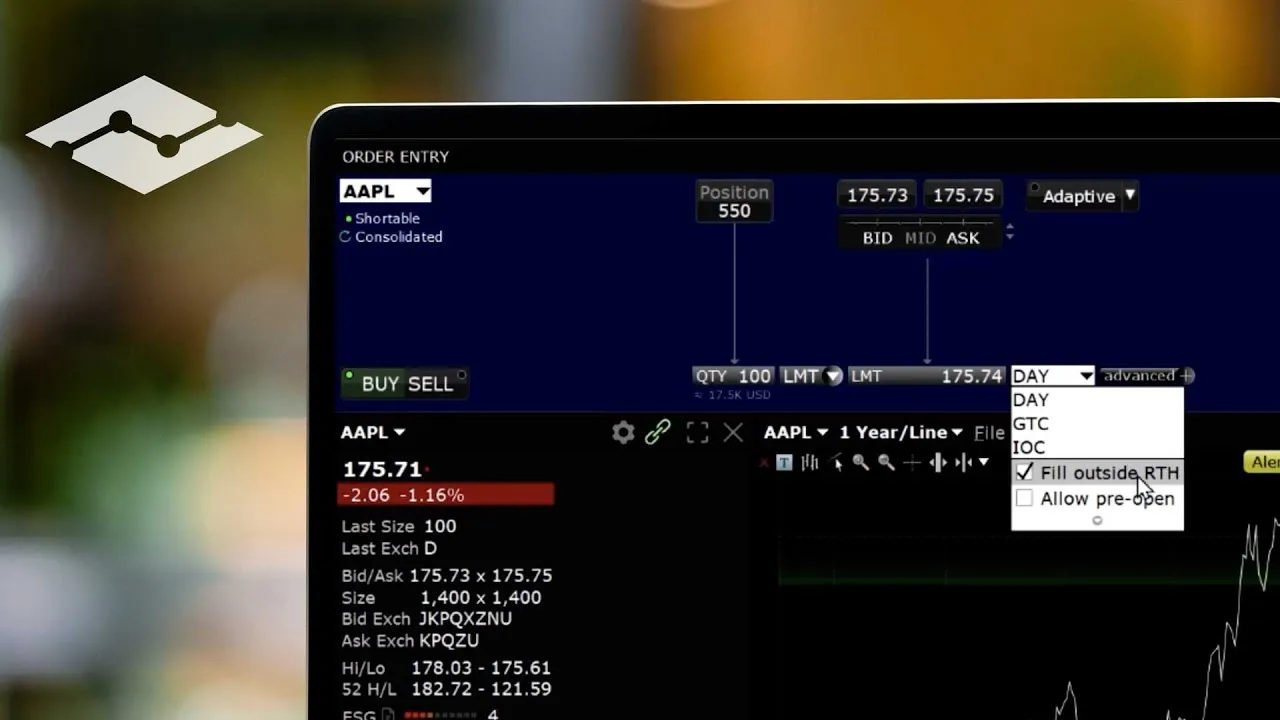
If you trade before 09:30 on IBKR, every order has to be allowed to fill outside regular trading hours, and outside those hours exchanges accept limit orders only. IBKR's own four-minute lesson shows where the setting lives in TWS, per order and as a default:
How momentum traders find stocks
You cannot trade what you have not found, and in this style the list is built fresh every morning. A scanner sorts the whole market by percent change, with a price band, a minimum change and a volume floor; you then check the news and the supply by hand for the few names that pass.
- How to find pre-market gappers is the morning routine: gap percent, pre-market volume, the catalyst check and a 07:00 to 09:30 ET checklist.
- Momentum trading on Interactive Brokers: scanner setup is the TWS side: the Advanced Market Scanner, which scan types to run, and how to live without a float filter.
- Free stock scanners for day trading covers the free options, what delayed data and slow refreshes cost you, and why your broker's own scanner is often the best free real-time one.
The scanner narrows the market to a few dozen names. Your job is to cut that to two or three, and the cut is mostly about the catalyst and the supply. A stock up 60% on a headline about a shelf registration is on the list because people are buying it. It is still a stock whose company can sell shares into every spike. Checking the filings on SEC EDGAR for a fresh shelf, prospectus or at-the-market offering takes five minutes and saves a lot of bad trades.
Momentum trading strategy: the three common entries
Small-cap momentum traders use a handful of patterns, and three of them do most of the work. All three have the same logic: buy where the stock proves buyers are still in control, and put the stop where that proof would be wrong.
Gap and go
A stock gapped up overnight, held its gains in the pre-market, and at or after the open it breaks above the pre-market high. The entry is the break; the stop goes under the last pullback low or a fixed number of cents below the entry. It is the first trade of the day for many momentum traders, and it fails often, because the pre-market high on a thin book can be a single print. Gap and go strategy covers the setup, the stop and the ways it breaks.
High of day breakout
Later in the morning, a runner pulls back, consolidates, then pushes toward its high of day. Sellers usually sit at the high. When they are cleared and the stock prints a new high of day, momentum traders buy the break. The fakeout, a break that reverses straight back under, is the main risk. High of day breakouts goes through reading the ask at the high and where to put the stop.
First pullback
After the first strong push, the stock dips for the first time. If that dip is on lighter volume and holds above a level such as VWAP, traders buy the first candle that makes a new high after it, with the stop at the pullback low. The tightest version, one small red candle in a fast move, is called a micro pullback. The first pullback strategy covers what a healthy pullback looks like and when it is not one.
Related chart patterns, such as the bull flag, are the same idea on a slightly longer clock: a strong push, a tight pause, a break.
Exits: where most of the money is made or lost
Entries get the attention; exits decide the result. Momentum traders mostly use some mix of three rules.
- Sell into strength. Momentum stocks spike and then pull back hard. Many traders sell half at a fixed multiple of their risk, often 2R (twice the distance to the stop), and hold the rest with the stop moved up. An R-multiple is just profit or loss divided by the planned risk.
- Move the stop to break-even once the trade is up enough that a normal pullback will not touch it. It turns a winner into, at worst, a scratch. Too early, and normal noise takes you out.
- Get out when the reason is gone. A big seller appears at the ask and keeps refilling, the tape slows, or an offering headline hits. You do not wait for the stop.
Two things can take the exit out of your hands. The first is a trading halt. Under the Limit Up-Limit Down plan, a typical small cap over $3.00 has a 10% price band during regular hours and one from $0.75 to $3.00 has a 20% band; a stock that cannot trade back inside its band is paused for five minutes, which can be extended for another five. A long position can reopen far below where it halted. The second is the pre-market itself: outside regular hours a broker stop order cannot protect you, which is why so many traders get hurt there. How stops work in the pre-market explains why, and what a stop can and cannot do before 09:30.
Risk: the part that decides whether you last
Every momentum trader who survives keeps two rules: a small fixed dollar risk per trade, and a daily loss limit that ends the day.
Fixed dollar risk. Choose the loss you accept first, then work out the shares from the stop: shares = dollar risk / stop distance. Say ABCD breaks its pre-market high at $4.20 and the last pullback low is $3.95. That is a 25-cent stop. With $50 of risk, the position is 200 shares ($840 of stock). If the stop were 10 cents, the same $50 buys 500 shares. The dollars stay the same; the size moves. The same sum works for any stock and any stop.
Slippage is part of the risk. On a thin pre-market book, your exit can fill well below your stop price. If ABCD drops through $3.95 and your sell fills at $3.85, the 200 shares lose $70, not $50: 1.4R instead of 1R. Plan for that by sizing smaller before 09:30, not by hoping.
A daily loss limit. Pick a number, for example three times your per-trade risk, and stop trading when you hit it. A bad morning in this style can turn into a bad month within an hour, because losses come in clusters and the urge to win it back is strong. Risk management for day traders covers the rest of the rules; Scalpel's daily loss limit shows one way to enforce it.
The honest odds
We will say this plainly, because the marketing around this style rarely does: the evidence says most people who day trade lose money, and very few are reliably profitable.
- Fernando Chague, Rodrigo De-Losso and Bruno Giovannetti followed every individual who started day trading Brazilian equity futures from 2013 to 2015 and kept at it for at least 300 days. 97% of them lost money, only 0.4% earned more than a bank teller (US$54 a day), and they found no evidence of learning by day trading (FGV EESP working paper 525, 2020).
- Brad Barber, Yi-Tsung Lee, Yu-Jane Liu and Terrance Odean studied day traders in Taiwan from 1992 to 2006 and found that less than 1% of the day trader population was able to predictably and reliably earn positive abnormal returns net of fees (Journal of Financial Markets, 2014).
- FINRA's required day-trading risk disclosure says it directly: day trading can be extremely risky, and you should be prepared to lose all of the funds you use for it.
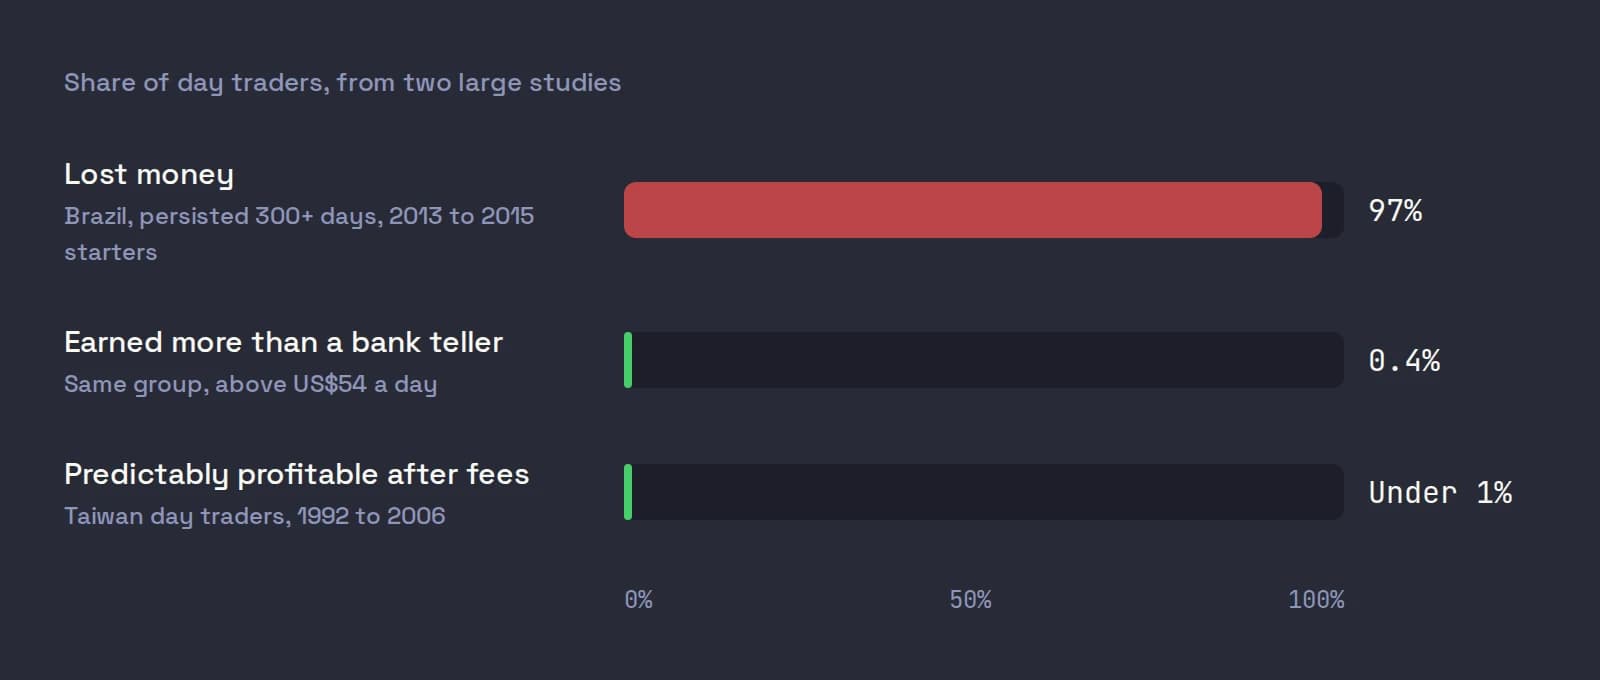
Neither study looked only at US small-cap momentum, and the samples are from other markets. We do not know of a study that isolates this exact style, and if anything its fast moves, halts and thin books make the arithmetic harder, not easier. Two more findings are worth knowing because they explain the failure modes. Wesley Chan found that extreme price moves without public news tended to reverse, mainly in smaller, illiquid stocks (Journal of Financial Economics, 2003). And Paul Tetlock found that individual investors trade more aggressively on stale news, and that the price move on stale news reverses the following week (Review of Financial Studies, 2011). A recycled press release on a low-float stock is exactly that situation.
What helps the odds, as far as anyone can tell: trading only the clearest setups, very small size while learning, honest records of every trade, and a hard stop on the day. None of that makes it easy.
Where Scalpel fits
Scalpel is a desktop cockpit that runs on your own Interactive Brokers account through TWS or IB Gateway, and it was built around this style. It does not find you winners and it does not trade for you. It removes steps.
- The scan. It runs IBKR's own market scanner over the API, pre-market included, merges top gainers, volume spikes, halts, hot by volume and gappers into one list, and puts live price, change, RVOL and shares outstanding on each row (set up the IBKR scanner).
- The checks. Catalyst, dilution and borrow chips on each row, from SEC EDGAR and the news on your IBKR account.
- The patterns. High of day momentum, Running up and Setups watch every name on the list and call out gap and go, micro pullback and high of day breaks by voice (scan types).
- The risk. Buy keys sized by dollar risk, an app-monitored stop armed on every entry, a daily loss limit that blocks new entries. The stops are watched by Scalpel, not resting at IBKR, so they only work while Scalpel is running with a live feed, and no fill is guaranteed.
Our two-minute scanner video shows the scan desk from the pre-market through the open:
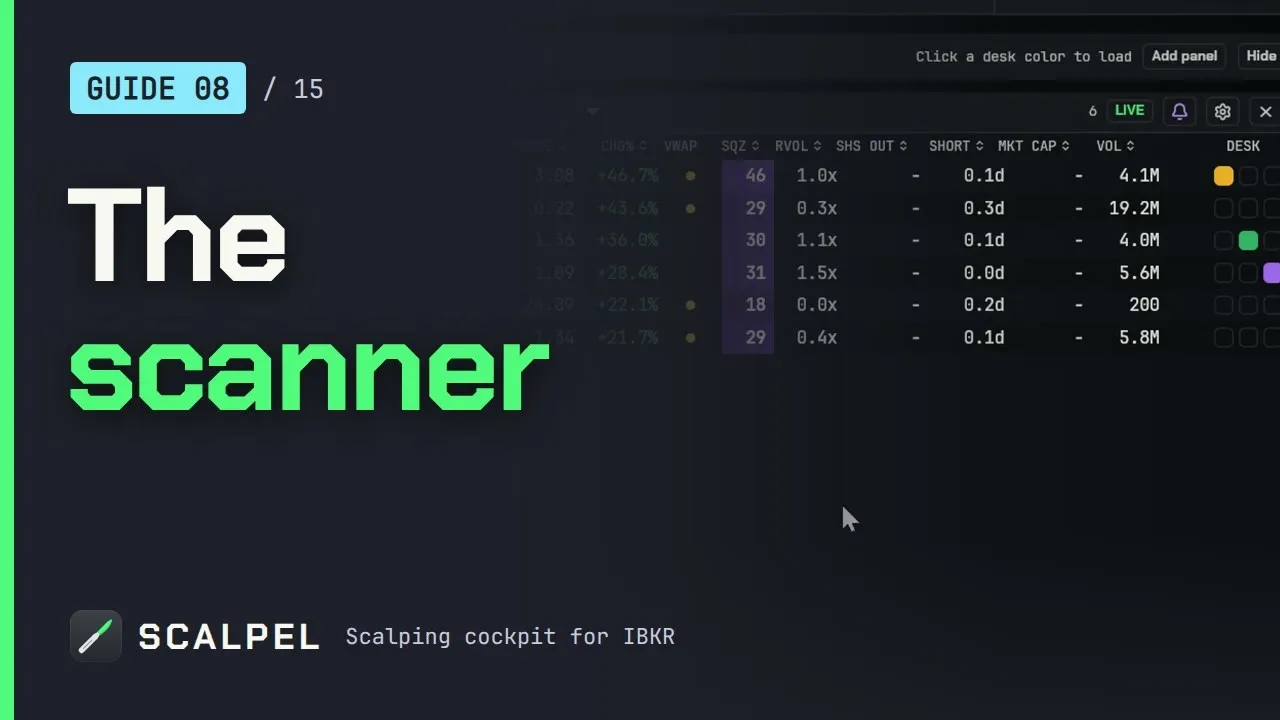
The momentum method guide maps each step of the style to a Scalpel feature, and the pre-market routine turns it into a morning checklist. Scalpel is long only and trades US stocks only: if you short small caps, it is not your tool.
Momentum and scanning: the full cluster
Every post on this topic, and what each one covers. The momentum and scanning hub lists them all.
- How to find pre-market gappers: the morning scan, gap and volume thresholds, and a 07:00 to 09:30 checklist.
- Relative volume (RVOL): the formula, time-of-day adjusted vs simple RVOL, and thresholds.
- News catalysts for day trading: which headlines move small caps, 8-K items on EDGAR, and red flags.
- Gap and go strategy: the pre-market high break, the stop, and where it fails.
- High of day breakouts: entries at the high, stops, and the fakeout.
- The first pullback strategy: buying the first dip after a breakout.
- The best time of day to day trade: the pre-market, the open, the midday lull and the close.
- Free stock scanners for day trading: what free scanners do and what they miss.
- Momentum trading on Interactive Brokers: scanner setup: the TWS scanner set up for gappers.
- Small-cap momentum trading on Interactive Brokers: what the style needs from a platform, and the IBKR gaps.
Trading carries a significant risk of loss. Nothing here is financial advice. Sources and IBKR, NYSE, Nasdaq and LULD details checked on October 22, 2026.
Questions
- What is momentum day trading?
- Buying a stock that is already moving hard, usually on news and heavy volume, and selling within minutes while the move lasts. In small caps it focuses on stocks priced about $2 to $20, up 10% or more, at 5 times normal volume or more, with a fresh catalyst and a low float.
- Is momentum day trading profitable?
- For most people, no. A study of Brazilian day traders who persisted for 300 days found 97% lost money, and a Taiwan study found less than 1% of day traders were reliably profitable after fees. It carries a significant risk of loss.
- What are the best momentum stocks to day trade?
- Momentum traders look for stocks with a fresh news catalyst, a low float, relative volume of 5x or more, a price of roughly $2 to $20, and a gain of 10% or more on the day. Those filters find candidates; they do not predict which ones will keep moving.
- What time of day is best for momentum trading?
- For small caps, the pre-market from about 07:00 ET and the first hour after the 09:30 ET open carry most of the volume and the biggest moves. Most runners fade by late morning.
- How much money do you need for momentum day trading?
- There is no fixed amount, but your risk per trade should be a small fraction of the account and you need a daily loss limit. Start in a paper account, then trade the smallest size you can.
- What is the difference between momentum trading and momentum investing?
- Momentum investing buys stocks that rose over the past 3 to 12 months and holds for months. Momentum day trading buys stocks moving hard today and holds for minutes. The academic evidence for the first says nothing about the second.
Related guides
Guide 14.6The momentum method Scalpel is built aroundThe small-cap momentum style Ross Cameron teaches, from stock selection to gap and go and micro pullbacks, mapped to Scalpel's scanner, intel and stops.Guide 14.2A pre-market routine with ScalpelA step-by-step routine from 04:00 ET to the open: connect, scan for gappers, check dilution and borrow, load your desks and set your risk before the bell.Guide 8.1Set up the IBKR scannerTurn on Scalpel's IBKR scanner: switch a desk to SCAN, set price, change, volume and share filters, and know how many market data lines the list uses.
Keep reading
- Momentum trading on Interactive Brokers: scanner setup for gappersInteractive Brokers momentum trading starts with the scanner: TWS settings for pre-market gappers, which scans to run, and how to live without a float filter.
- Small-cap momentum trading on Interactive Brokers: what you needSmall-cap momentum trading on Interactive Brokers: what the Warrior Trading review says, and how to get scanning, hotkeys, fixed risk and pre-market stops.
- How to find pre-market gappers each morningPremarket gappers, found the same way every morning: gap math, scanner settings, volume floors, four checks and a 07:00 to 09:30 ET checklist.
Practice in SIM, against the live book.A lifetime license, every update included, with a 7-day refund guarantee.Ask in DiscordGet Scalpel