The first pullback: buying the first dip in a momentum stock
By Scalpel Team. , updated . 8 min read.
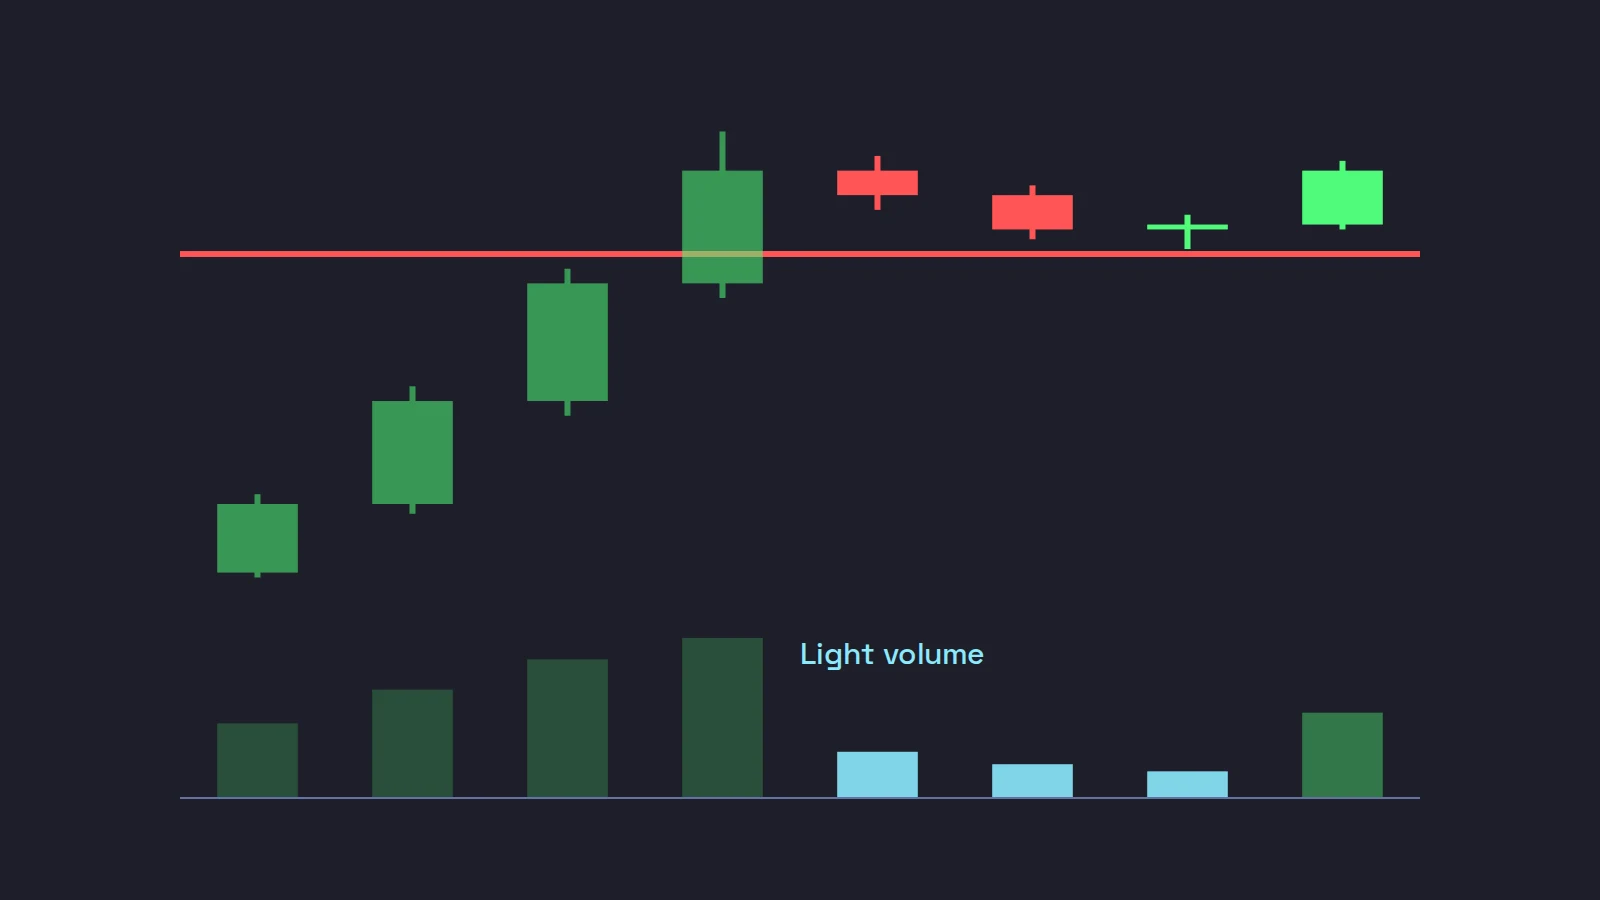
In short
The first pullback strategy buys the first dip after a momentum stock's opening push. You wait for a strong first move on heavy volume, let the stock pull back on lighter volume while it holds a level that matters (the breakout point, VWAP or most of the push), then buy as the first candle trades above the previous candle's high. The stop goes just under the pullback low, and the size comes from that distance. It fails when the dip is deep, when sellers come in on heavy volume, or when the "first" pullback is really the third.
Most traders find momentum stocks after they have already moved. The first pullback is the patient answer to that: instead of chasing the first push, you let it rest and buy the moment it turns back up, with a stop that is close and obvious. When it works, you are in near the high of the move with a small risk. When it fails, you find out fast.
This post covers what separates a good first pullback from a falling knife, where the entry and stop go, a worked example with real numbers and costs, and how the setup fails. It is part of our momentum day trading cluster. The examples use fictional tickers, and none of this suggests the style is easy: most people who try fast small-cap trading lose money.
What the first pullback strategy is
A momentum stock rarely goes up in a straight line. It pushes, rests, then either pushes again or rolls over. The first rest after the opening push is the first pullback. Traders like it for three reasons:
- Buyers who missed the push are waiting. They did not want to chase, and the dip is their entry too.
- Holders have not yet been tested. The first dip shows whether early buyers sell at the first red candle or hold.
- The stop is obvious. The low of the dip is a clear line: if price breaks it, the pullback has become a reversal.
It is the same idea as a bull flag, seen at the very start of the move: a pole, then a short, orderly rest.
What makes a good pullback: the checklist
| Check | A good first pullback | A warning sign |
|---|---|---|
| The push before it | Strong, fast, on relative volume of several times normal | A slow drift up on ordinary volume |
| Depth | Holds most of the push. Many traders want it to give back less than half | Gives back more than half, or undercuts the breakout level |
| Volume on the pullback | Clearly lighter than on the push | Red candles on heavier volume than the green ones |
| Level | Holds above VWAP and the breakout point | Loses VWAP and does not reclaim it |
| Count | The first pullback of the move | The third or fourth, after the news is hours old |
| Supply | No fresh offering on file | A shelf or ATM offering that can sell stock into every spike |
Light volume on the dip is the heart of it. A pullback on light volume says holders are mostly sitting tight and the sellers are small. A pullback on heavy volume says someone large is getting out, and they may not be done.
Micro pullback vs first pullback
A micro pullback is a smaller, faster version: one red or indecision candle in the middle of a fast move, often on a 10-second or 1-minute chart, followed by a candle that takes out its high. The first pullback is usually a few candles long and comes after the first big push. The entry logic is the same for both: buy the first candle that makes a new high after the dip. The micro version gives you a tighter stop and less time to think, which suits only traders who already execute well on hotkeys.
Where to enter: the first candle to make a new high
The classic trigger is simple to state: once the pullback has formed, buy when price trades one cent above the high of the previous candle. That is the first sign the dip has ended and buyers are back in control.
There are two ways to take it:
- On the key. Watch the candle, and as it trades through the prior candle's high, buy with a marketable limit at the ask plus a few cents. You see the tape and the book as you press.
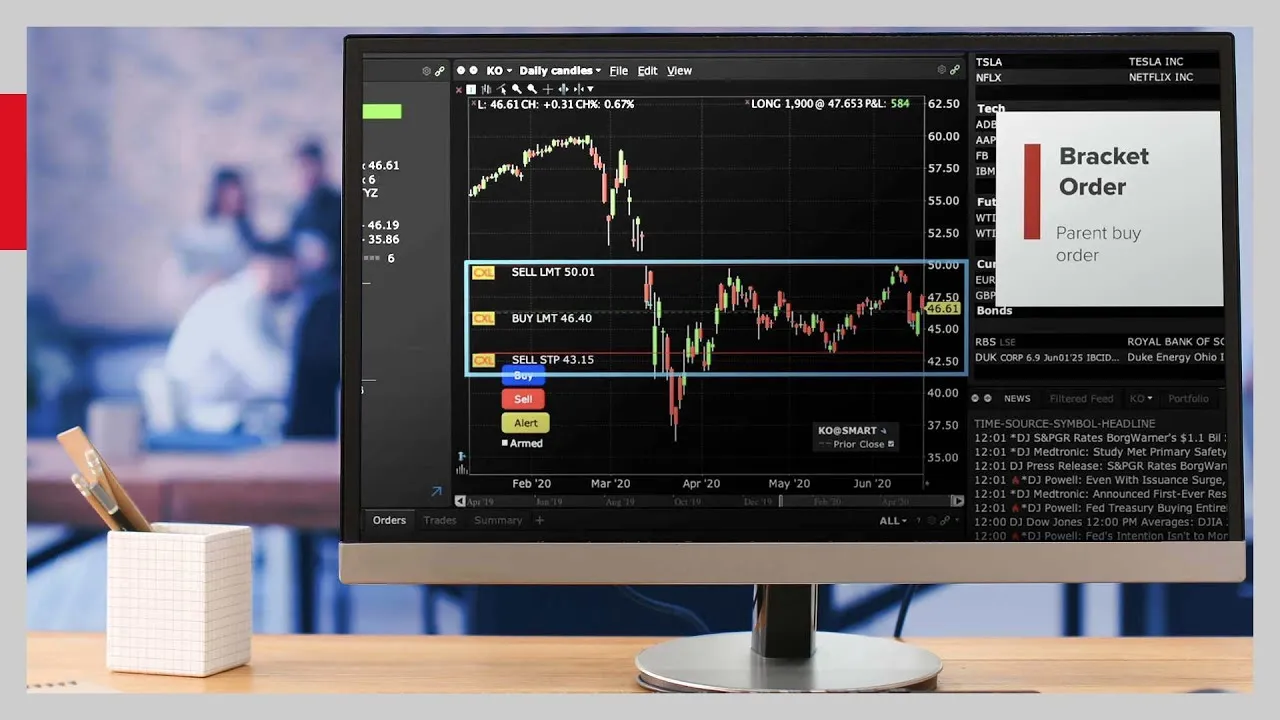
- With a resting order. In TWS, place a buy stop-limit a cent above the pullback candle's high, with the limit a few cents higher, and attach a stop and a target as one bracket order. If the stock rolls over instead, the entry never triggers.
This Interactive Brokers lesson shows how bracket orders work in TWS Mosaic: one entry with a stop loss and a profit target attached, so both exits are in place the moment you fill.
One caution for the pre-market, where many first pullbacks happen: outside regular hours, an IBKR stop or bracket leg only works with the outside RTH setting, and even then a stop-limit can be jumped in a thin book. IBKR's lesson on trading outside regular trading hours shows the setting, and our pre-market stop loss post explains the problem.
A worked example with real numbers
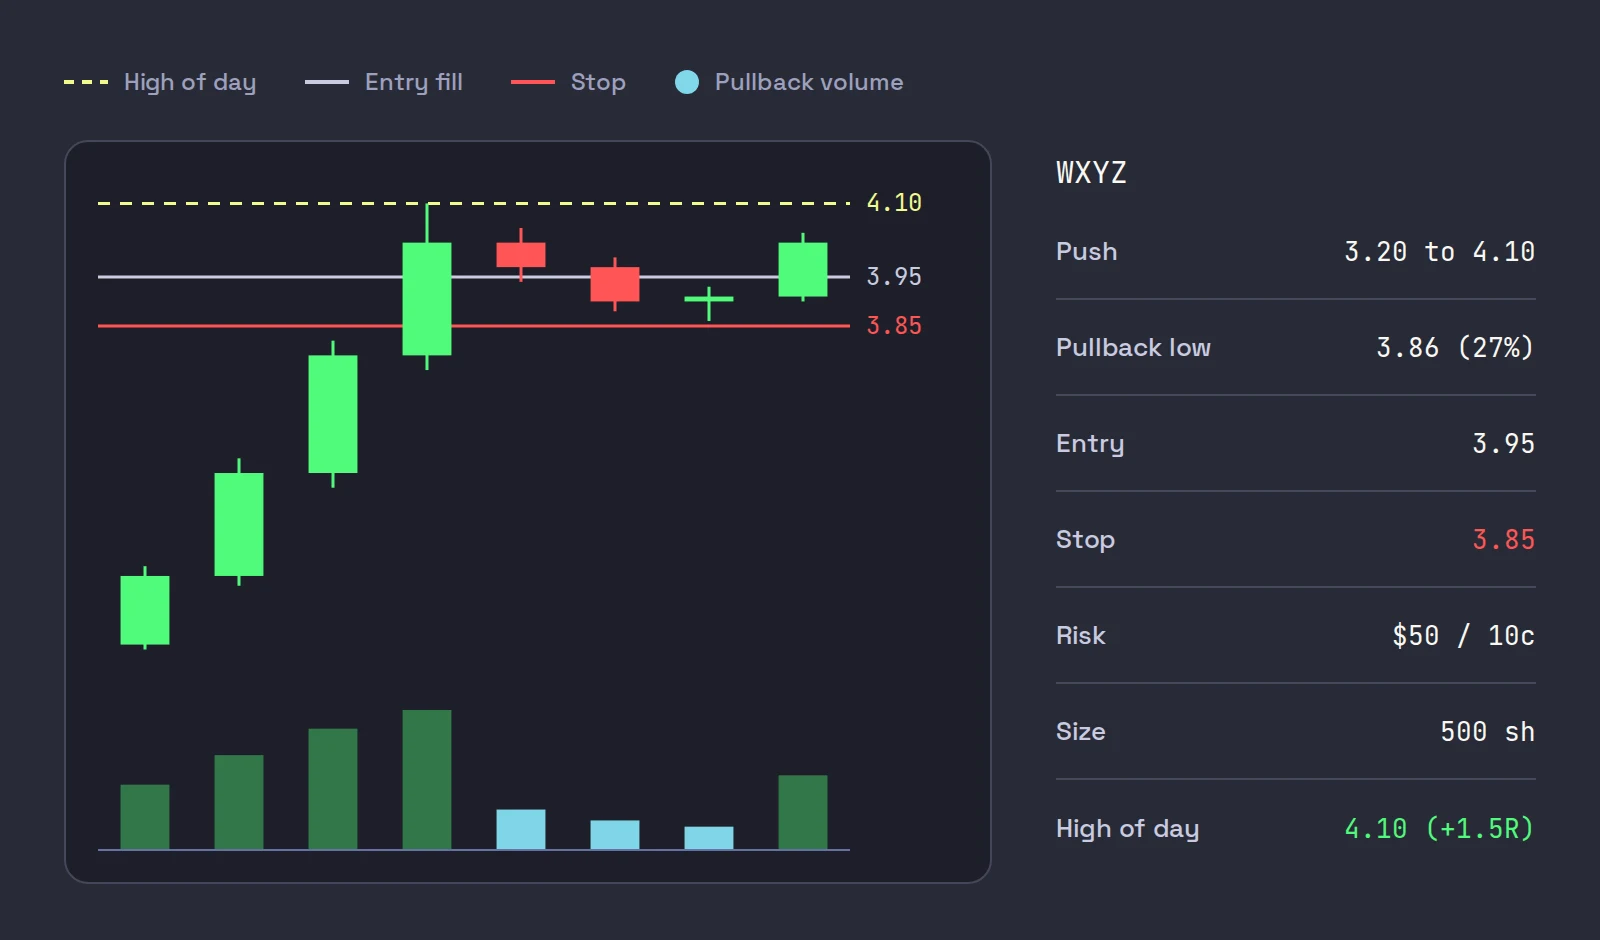
A fictional stock, WXYZ, has news out at 07:05 ET. It pushes from 3.20 to a high of 4.10 on heavy volume. Then it rests: three candles drift down to a low of 3.86 on volume well under half that of the push. It holds above VWAP the whole time. The last pullback candle has a high of 3.93.
- The depth. The push was 0.90 (3.20 to 4.10). The pullback gave back 0.24, about 27% of it: shallow.
- Entry. The next candle trades through 3.93. You buy at the ask with a few cents of offset and fill at an average of 3.95.
- Stop. One cent under the pullback low, at 3.85. Risk per share: 3.95 minus 3.85 = 0.10.
- Size. With $50 of risk, 50 / 0.10 = 500 shares, about $1,975 of stock.
- Targets. The high of day at 4.10 is the first test, 0.15 above the entry: 1.5R. A 2R target sits at 4.15, just above it. Many traders sell half into the retest of the high and move the stop to break-even on the rest.
- Costs. On IBKR Pro Fixed pricing, USD 0.005 a share with a USD 1.00 minimum (IBKR commissions), 500 shares cost $2.50 each way, $5.00 for the round trip. On Tiered pricing the commission is USD 0.0035 a share (minimum USD 0.35) for the first 300,000 shares a month, plus exchange, clearing and regulatory fees. Checked on October 22, 2026.
The cost line is the one most people skip. On a 10c stop, $5.00 of commission is a tenth of your risk, before any slippage. Tight stops make the pullback attractive, and they also make costs a real share of every trade. Our guide to sizing presets covers the ways to turn a stop into a share count.
How the first pullback fails
The setup fails in a few recognizable ways, and each one has a tell:
- The dip keeps going. It gives back more than half the push, or breaks the level the stock broke out from. That is no longer a pullback, and buying it is guessing at a bottom.
- Sellers on volume. The red candles carry more volume than the green ones did. Someone big is selling into every bid.
- The new-high candle fails. You buy the break of the prior candle's high, and the candle closes back under it. Many traders exit there rather than wait for the stop.
- It halts down, or halts up then reopens lower. In regular hours, a stock above $3 outside the S&P 500 and Russell 1000 has a 10% limit up-limit down band around its average price over the last five minutes, and if it sits at the edge for 15 seconds, trading pauses for five minutes (FINRA on LULD). A stock can reopen well away from your stop.
- Dilution. A company with an offering on file can sell stock into the spike, and the first pullback becomes the first leg down. Check recent filings on SEC EDGAR before the trade, not after it. Our guide to checking for dilution covers what to look for.
Later pullbacks deserve more caution than the first. Each one comes after more buyers are already in and the news is older, so there are fewer fresh buyers left to push it.
Does the first pullback work?
Nobody can honestly give you a win rate for this pattern: it depends on the stock, the day, your execution and how strictly you define it. What the research does say is that day trading profits are rare. Barber, Lee, Liu and Odean (2014, Journal of Financial Markets) studied day traders in Taiwan from 1992 to 2006 and found that less than 1% of them could predictably and reliably earn positive returns net of fees. A pattern is a way to define risk, not an edge by itself. Practice it in a paper account long enough to measure your own results, and see the related setups in high of day breakouts and gap and go.
Where Scalpel fits
Scalpel is a keyboard-first desktop cockpit for your own IBKR account, connected through TWS or IB Gateway. It does not find or take the trade for you, but it removes several steps between seeing a pullback and being in it with a stop (the momentum method).
The Setups scan marks a micro pullback with an M chip ("Micro pullback"): a shallow pullback during a fast move, then a reclaim of the recent high on volume. A bull flag gets an F. The chips show on every scan panel while the setup is live, and they say a pattern is there, not that it will work (scan types).
Sizing from the stop. With Risk (Cents), each buy button is a dollar risk and the Stop stepper sets the distance: set 10c and a $50 button buys 500 shares of WXYZ, with the stop placed 10c under the fill (trade a fixed dollar risk).
Stops that work before the open. The stop is watched by the app, and in LIVE it exits with a limit sell 5 cents under the last trade, flagged for extended hours, so it can act in the pre-market where a plain broker stop cannot (how stops work). It only works while Scalpel runs with a live feed, and no fill is guaranteed in a fast drop. Our placing trades video shows the buy keys, the presets and the order bar.
Scalpel is long only and has no resting buy-stop entry: you press when the candle breaks. If you prefer a bracket that triggers on its own while you watch, TWS does that and Scalpel does not.
Trading carries a significant risk of loss. Nothing here is financial advice.
Questions
- What is the first pullback strategy?
- It buys the first dip after a momentum stock's opening push. The trader waits for a light-volume pullback that holds a key level, then buys as the first candle trades above the previous candle's high, with a stop just under the pullback low.
- Where do you put the stop on a first pullback?
- Most traders put it one or two cents under the low of the pullback. If price breaks that low, the dip has turned into a reversal and the setup is wrong.
- How deep should a first pullback be?
- Shallower is better. Many momentum traders want the pullback to give back less than half of the first push and to hold above VWAP and the breakout level.
- What is the difference between a micro pullback and a first pullback?
- A micro pullback is one small red or indecision candle inside a fast move, often on a 10-second or 1-minute chart. A first pullback is usually several candles long and comes after the first big push of the day.
- Why does volume matter on a pullback?
- Light volume on the dip suggests holders are sitting tight and selling is small. Heavy volume on red candles suggests a large seller, and the dip often keeps going.
Related guides
Guide 14.6The momentum method Scalpel is built aroundThe small-cap momentum style Ross Cameron teaches, from stock selection to gap and go and micro pullbacks, mapped to Scalpel's scanner, intel and stops.Guide 4.2Trade a fixed dollar risk with Risk (Cents)Risk the same dollars on every scalp: Scalpel works out the shares from your stop as you press. Set Risk (Cents), size your buttons and nudge the stop.Guide 5.1How Scalpel's stops workWhy Scalpel holds your stops in the app, not on the book: pre-market rules, the working stop, catastrophe net and take-profit, and what if Scalpel closes.
Keep reading
- Momentum day trading: how small-cap momentum worksMomentum day trading explained: what makes small caps move, the shape of the day, entries, exits and risk, and what the research says about the odds.
- Momentum trading on Interactive Brokers: scanner setup for gappersInteractive Brokers momentum trading starts with the scanner: TWS settings for pre-market gappers, which scans to run, and how to live without a float filter.
- Small-cap momentum trading on Interactive Brokers: what you needSmall-cap momentum trading on Interactive Brokers: what the Warrior Trading review says, and how to get scanning, hotkeys, fixed risk and pre-market stops.
Practice in SIM, against the live book.A lifetime license, every update included, with a 7-day refund guarantee.Ask in DiscordGet Scalpel