High of day breakouts: entries, stops and the fakeout
By Scalpel Team. , updated . 9 min read.
In short
A high of day breakout is a long entry taken as a momentum stock trades above the highest price it has printed today, on heavy volume, with buyers clearing the sellers sitting at that level. You buy as the high gives way (a marketable limit at the ask plus a few cents, or a buy stop-limit just above the high), put the stop where the breakout is proven wrong, usually under the last higher low or the tight range under the high, and size the trade from that stop. The fakeout, a poke above the high that closes back under it, is the most common way the trade fails: when it happens, get out instead of hoping.
The high of day breakout is the simplest momentum entry to describe and one of the hardest to trade well. Every trader watching the stock can see the same level. Some are waiting to buy the break, some have been short since the last push and have stops above it, and some bought lower and plan to sell into it. When price gets there, those three groups decide the next minute between them.
This post covers what makes a high of day worth trading, how to read the ask at the level, three entry triggers and their trade-offs, where the stop goes, and how to spot the fakeout early. It is written for long-only small-cap momentum traders, the style covered in our pillar on momentum day trading. Scalpel is independent and not affiliated with or endorsed by Interactive Brokers.
What a high of day breakout is
The high of day (HOD) is the highest trade price the stock has printed today. A breakout is the first trading above it after price has backed off and come back. A stock grinding to a new high every few seconds is not breaking out of anything: it is just running, and there is no level to define your risk against.
Two details trip people up:
- Which high. Before 09:30 ET the high of day is the pre-market high. Charting platforms differ on whether they include extended hours in the day's high, so check your chart settings before you plan a trade around a number your platform may not be showing.
- Which session. In regular hours, a breakout that runs too fast can be paused by the limit up-limit down rules. In the pre-market those guardrails do not apply, which cuts both ways. More on both below.
The setups that make a high of day break worth watching are the same ones that make any momentum stock worth watching: a fresh catalyst, strong relative volume and a small supply of shares. A new high on a stock trading at normal volume with no news is a much weaker signal.
Why the high of day is a battle line
A high of day is where the last push ran out of buyers. Someone sold there, in size, and the stock backed off. When price returns, the question is whether that seller is still there.
Round numbers make it worse. In a study of more than 100 million US stock transactions, Bhattacharya, Holden and Jacobsen (2012, Management Science) found excess buying by liquidity demanders one penny below round numbers and excess selling one penny above, with the imbalance largest around whole dollars and next largest around half dollars. A high of day at 5.99 or 6.00 is not a coincidence: sellers like to sit just over a round number, and buyers like to stop just under one. Our post on whole and half dollar levels covers this in more depth.
How to read the ask at the high of day
The chart tells you where the level is. Level 2 and the tape tell you whether it is about to give.
| What you see at the high | What it usually means |
|---|---|
| A large ask at the level that shrinks as prints hit it | A real seller being absorbed. The break is close |
| Prints at the ask, fast, in rising size | Buyers are paying up, not waiting on the bid |
| The bid stepping up a few cents at a time under the level | Buyers are willing to pay more each minute. Pressure builds |
| An ask that refills to the same size after every print | A hidden seller (iceberg). The level may hold far longer than it looks |
| A big ask appearing just as price arrives, then vanishing | Possibly a display meant to scare buyers. Do not trade off it alone |
| Prints at the bid and a bid that drops away | Sellers are winning. No trade yet |
Our guide to reading Level 2 walks through these in detail. The single most useful habit: watch the ask at the level for a full minute before the price gets there. You learn its size, whether it refills, and how fast the tape is eating it.
Entry triggers for a breakout trading strategy
There are three common ways to enter. None is right for every stock.
| Trigger | When you buy | Upside | Downside |
|---|---|---|---|
| Anticipation | Just under the high, while the ask is being eaten | Best price and the tightest stop | More failed trades, because some levels hold |
| The break | As the first prints trade above the high | Confirmation that the seller is gone | You pay the spread and any slippage in a fast book |
| The confirmation | On the first pullback that holds above the old high | The level has flipped from resistance to support | Many strong breakouts never pull back, so you miss them |
The third trigger is close to the first pullback strategy, and it is the one we would suggest to anyone still learning: fewer trades, each with a clear stop.
To take the break in TWS without clicking, you can rest a buy stop-limit order: the stop a cent or two above the high, the limit a few cents above that. IBKR's own stop-limit order page states the trade-off plainly: the limit caps your price, but the order may never fill even if the stop price is reached. In a fast small cap, a 1c limit over the stop often misses; 5 to 10 cents is more realistic, and still not a guarantee. Outside regular hours the order needs the outside RTH setting, which IBKR's lesson on trading outside regular trading hours shows.
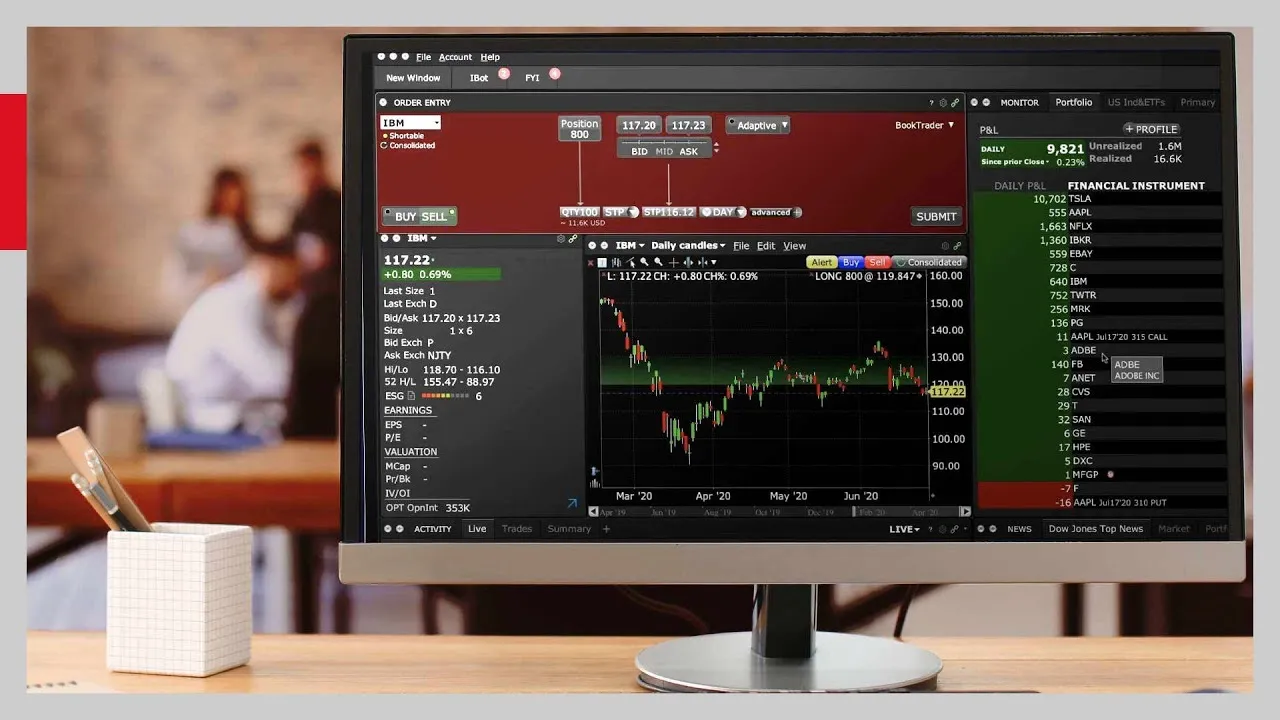
This Interactive Brokers lesson shows how stop and stop-limit orders are built in TWS Mosaic, which is the same order ticket you would use for a resting breakout entry.
A worked example with real arithmetic
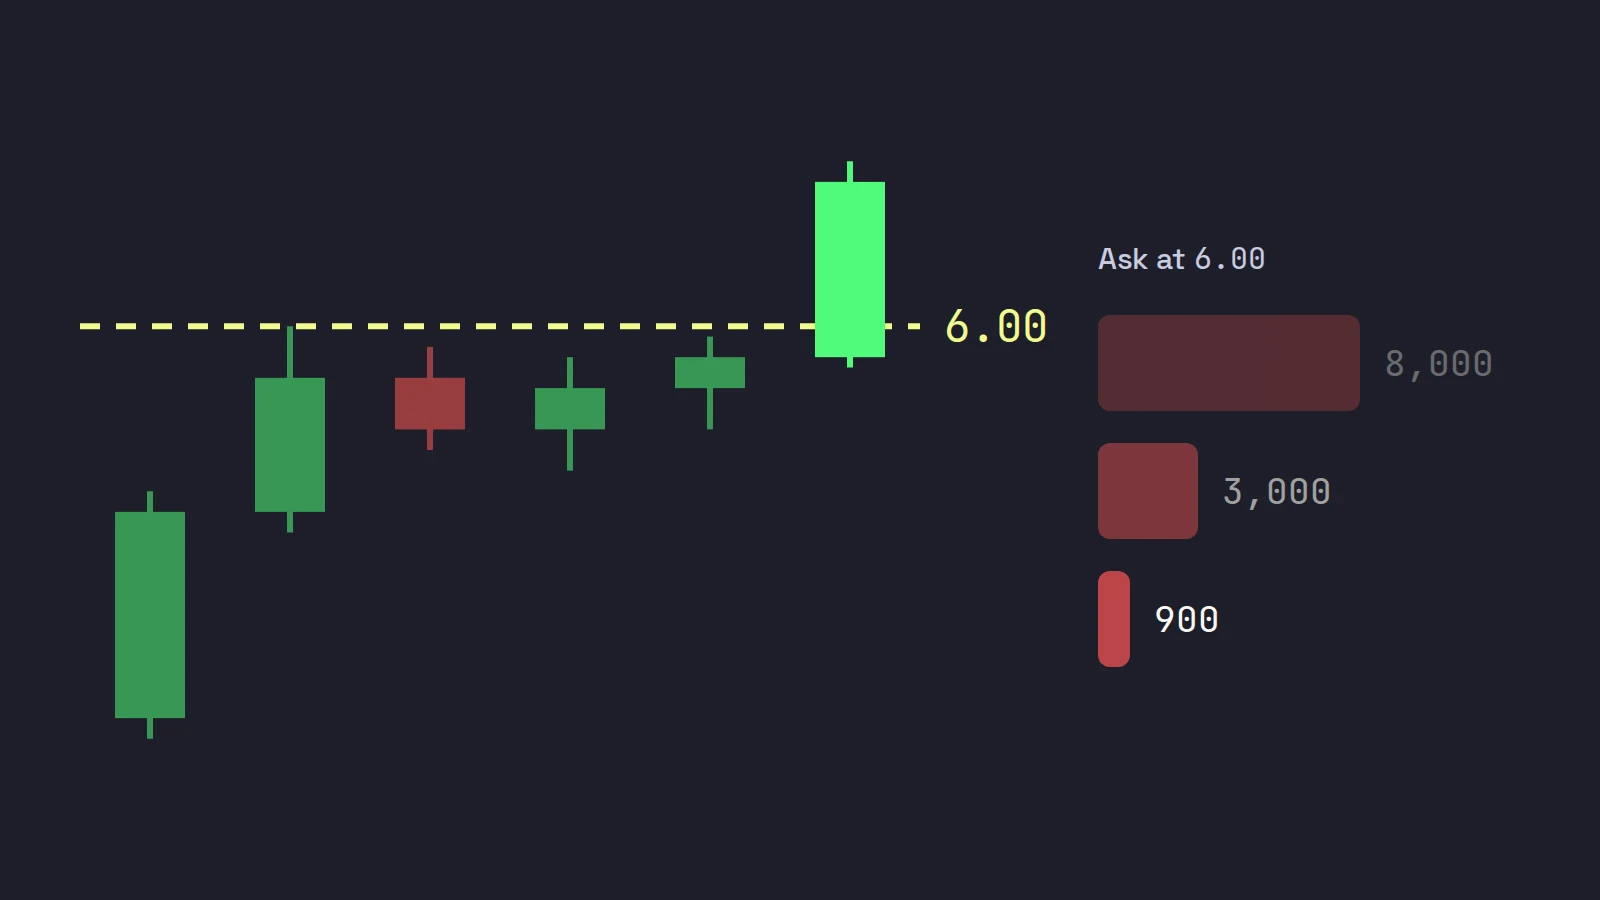
A fictional stock, ABCD, is up 60% on news. Its high of day is 6.00. Since the last push it has held in a tight range between 5.86 and 5.99, and an ask of 8,000 shares sits at 6.00. Prints start hitting it; the ask drops to 3,000, then 900.
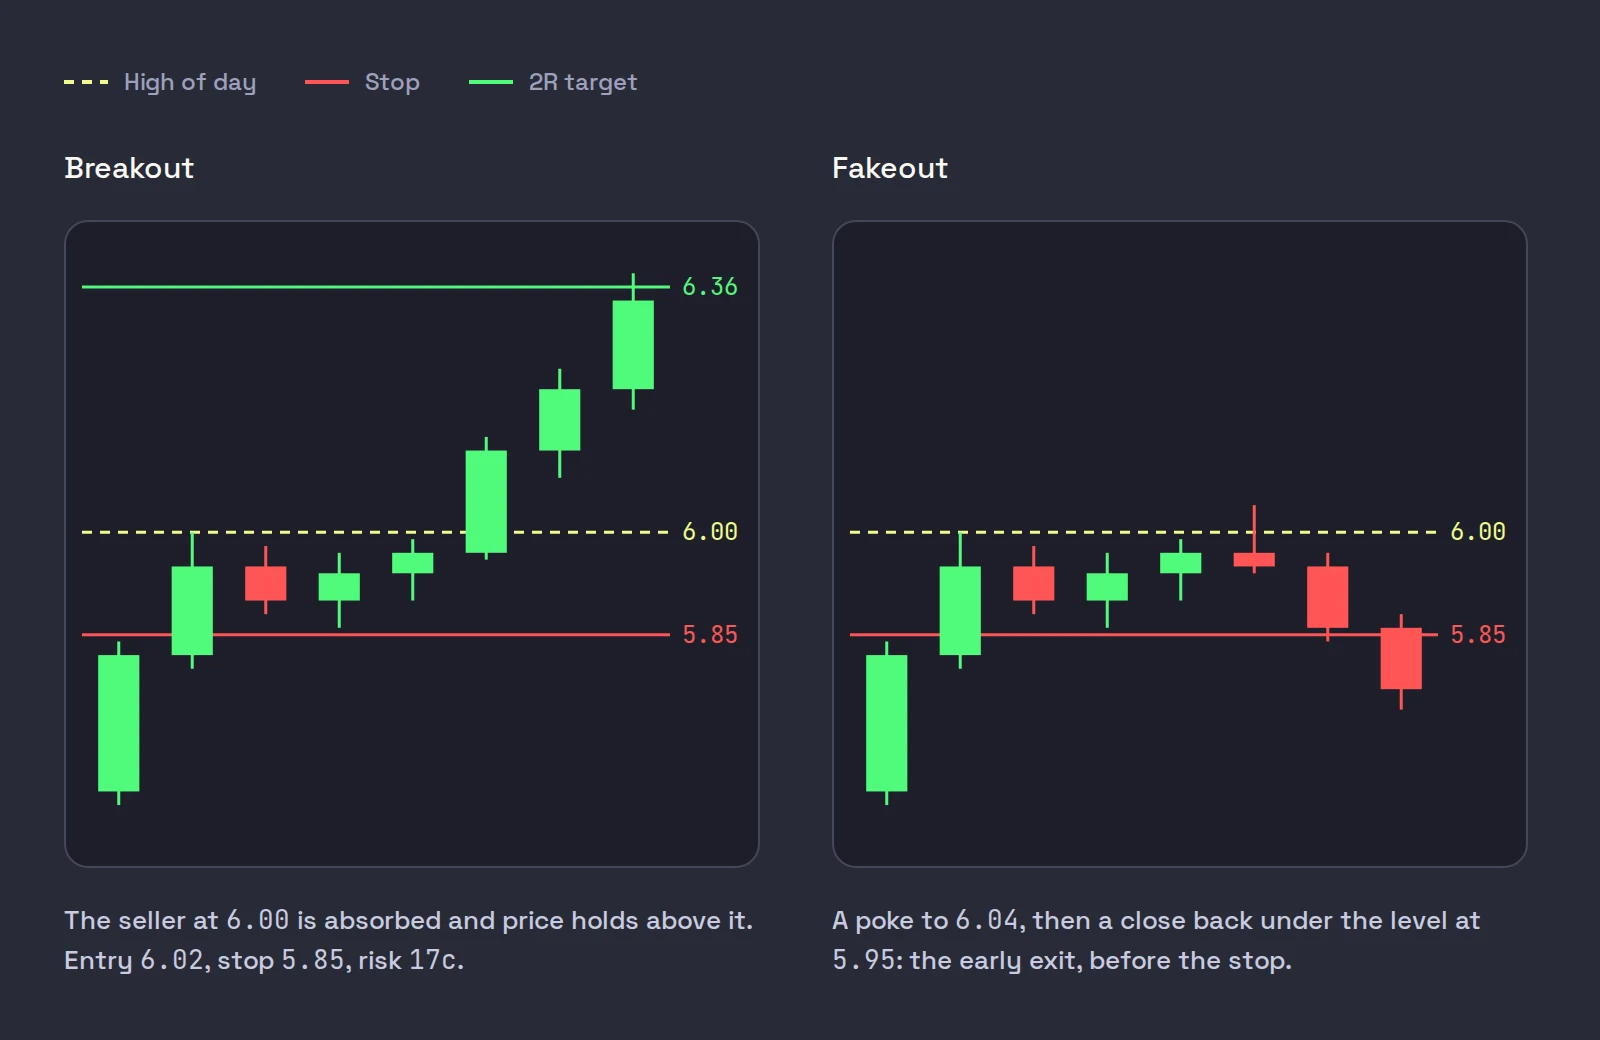
- Entry. You buy as 6.00 trades through with a marketable limit at 6.01 plus 5 cents, a limit of 6.06. The book fills you at an average of 6.02.
- Stop. The tight range under the high bottomed at 5.86, so the stop goes one cent under, at 5.85. Risk per share: 6.02 minus 5.85 = 0.17.
- Size. With $50 of risk, 50 / 0.17 = 294 shares (rounded down).
- Target. A 2R target sits 0.34 above the entry, at 6.36.
- Costs. On IBKR Pro Fixed pricing, at USD 0.005 per share with a USD 1.00 minimum (IBKR commissions), 294 shares cost about $1.47 each way, $2.94 for the round trip: about 0.06R before any slippage. Checked on October 22, 2026.
Now the honest part. If ABCD trades back under 6.00 and closes the 1-minute candle at 5.95, the breakout has failed even though your stop is still 10 cents away. Many traders exit there instead of waiting for 5.85. The stop is where you are certainly wrong; the close back under the level is where you are probably wrong.
Where to put the stop on a high of day breakout
| Stop placement | Distance on ABCD | When it fits |
|---|---|---|
| Just under the breakout level (5.98) | 4c | Very liquid stocks with a clean level. Gets shaken out often on small caps |
| Under the tight range under the high (5.85) | 17c | The default for most HOD breaks: under the base the break came from |
| Under the last higher low on the 1-minute chart | Wider | Slower stocks where the range is loose. Cut size to keep the dollar risk the same |
Whatever you choose, size from the stop, never the other way round. How stops work in Scalpel covers why a stop on a pre-market breakout cannot be a plain broker stop.
The fakeout: how high of day breakouts fail
The fakeout, or bull trap, is a print or two above the high, a burst of buyers, then a candle that closes back under the level. The shorts were not squeezed, the seller reloaded, and everyone who bought the break is now trapped above the market. They become sellers on the way down.
The signs usually show before the candle closes:
- The ask refills at the new high. The seller you thought was gone moved up a cent or two.
- Prints switch to the bid within seconds of the break.
- Volume on the break is lighter than on the push that set the high.
- The stock is extended. It is far above VWAP after several green candles with no rest, so late buyers have nobody left to sell to.
Two more failure modes are specific to small caps:
- The halt. In regular hours, the limit up-limit down rules apply from 09:30 to 16:00 ET. A stock that is not in the S&P 500 or Russell 1000 and trades above $3 gets a band 10% either side of its average price over the preceding five minutes (20% from $0.75 to $3). If the price sits at the edge of the band for 15 seconds, trading pauses for five minutes. A breakout that runs straight into an upper limit state can halt with you in it, and it can reopen lower. Our post on LULD trading halts covers what happens to your orders.
- No guardrails before the open. The SEC's extended-hours investor bulletin warns that mechanisms that address volatility may be limited or not available during extended hours, and that spreads are generally wider. A pre-market breakout can reverse 20% without a single pause.
Is the high of day breakout worth trading?
It can be one entry in a trader's playbook. It is not an edge on its own. When Barber, Lee, Liu and Odean (2014, Journal of Financial Markets) studied day traders in Taiwan from 1992 to 2006, they found that less than 1% of the day trader population could predictably and reliably earn positive returns net of fees. Breakouts are exactly the trade everyone can see, so the level alone tells you little. What matters is whether this stock, today, has the volume and the news to clear it, and whether you cut the trade fast when it does not.
Time of day matters too. Small-cap momentum traders focus on the pre-market and the first hour, when volume is heaviest; a new high at 13:30 on thinning volume has fewer buyers behind it. See the best time to day trade and, for the setup that often comes first, gap and go.
Where Scalpel fits
Scalpel is a keyboard-first desktop cockpit for your own IBKR account, connected through TWS or IB Gateway. It does not have a resting buy-stop entry: every entry is a key you press when you see the break. What it adds is the parts around that key press (scan types):
- High of day momentum lists any stock on the IBKR scanner's list the moment it trades above its high of day, pre-market included, and keeps it there for 60 seconds after each new high.
- The H chip ("Breaking highs") marks a new high of day in regular hours on every scan panel.
- Buy keys send a marketable limit at the ask plus your offset, sized from your dollar risk. With Risk (Low), the stop sits just under the lowest low of the last 20 one-minute bars (the momentum method).
- Dragging the stop onto the base under the high takes one mouse move, and the size and R update on the chart (drag stops and targets).
- A bull trap warning. While you hold a long, Scalpel watches closed 1-minute bars for a poke above the recent high that closes back under it, and shows a toast with a voice warning.
Our stops and targets video shows the working stop, the target and how to drag both on the chart.
The bull trap warning describes the last candle; it does not predict the next one with any certainty. Scalpel's stops are app-monitored, not resting orders at IBKR, so they only work while Scalpel runs with a live feed, and no exit fill is guaranteed in a fast drop.
Trading carries a significant risk of loss. Nothing here is financial advice.
Questions
- What is a high of day breakout?
- It is a long entry taken when a stock trades above the highest price it has printed so far today, after backing off and coming back. Traders look for heavy volume and buyers clearing the sellers at the level.
- Where do you put the stop on a HOD breakout?
- Many traders put it under the tight range the stock built just below the high, or under the last higher low on the 1-minute chart. Then they size the position so that stop distance equals their fixed dollar risk.
- How do you tell a real breakout from a fakeout?
- A real break shows prints at the ask, a shrinking seller and rising volume, and it holds above the level. A fakeout pokes above, the ask refills, prints move to the bid, and the 1-minute candle closes back under the old high.
- Does the pre-market high count as the high of day?
- For momentum traders it usually does, because the pre-market high is the level everyone watches into the open. Charting platforms differ on whether they include extended hours, so check your chart's session settings.
- Can a breakout get halted?
- Yes, in regular hours. Under the limit up-limit down rules, a stock above $3 that is not in the S&P 500 or Russell 1000 pauses for five minutes if it sits at the edge of a 10% band for 15 seconds.
Related guides
Guide 14.6The momentum method Scalpel is built aroundThe small-cap momentum style Ross Cameron teaches, from stock selection to gap and go and micro pullbacks, mapped to Scalpel's scanner, intel and stops.Guide 5.2Move your stop and target on the chartDrag the stop or take-profit line (or its axis tag) on Scalpel's chart, add a target with the + TP handle, reset with a double-click, and know the limits.Guide 3.1How to read Level 2 in ScalpelRead Scalpel's DAS-style Level 2: bids left, asks right, optional colour bands per price, venues, spread, imbalance and delta, and reading players by behaviour.
Keep reading
- Momentum day trading: how small-cap momentum worksMomentum day trading explained: what makes small caps move, the shape of the day, entries, exits and risk, and what the research says about the odds.
- Momentum trading on Interactive Brokers: scanner setup for gappersInteractive Brokers momentum trading starts with the scanner: TWS settings for pre-market gappers, which scans to run, and how to live without a float filter.
- Small-cap momentum trading on Interactive Brokers: what you needSmall-cap momentum trading on Interactive Brokers: what the Warrior Trading review says, and how to get scanning, hotkeys, fixed risk and pre-market stops.
Practice in SIM, against the live book.A lifetime license, every update included, with a 7-day refund guarantee.Ask in DiscordGet Scalpel