Relative volume (RVOL): the number that finds stocks in play
By Scalpel Team. , updated . 7 min read.
In short
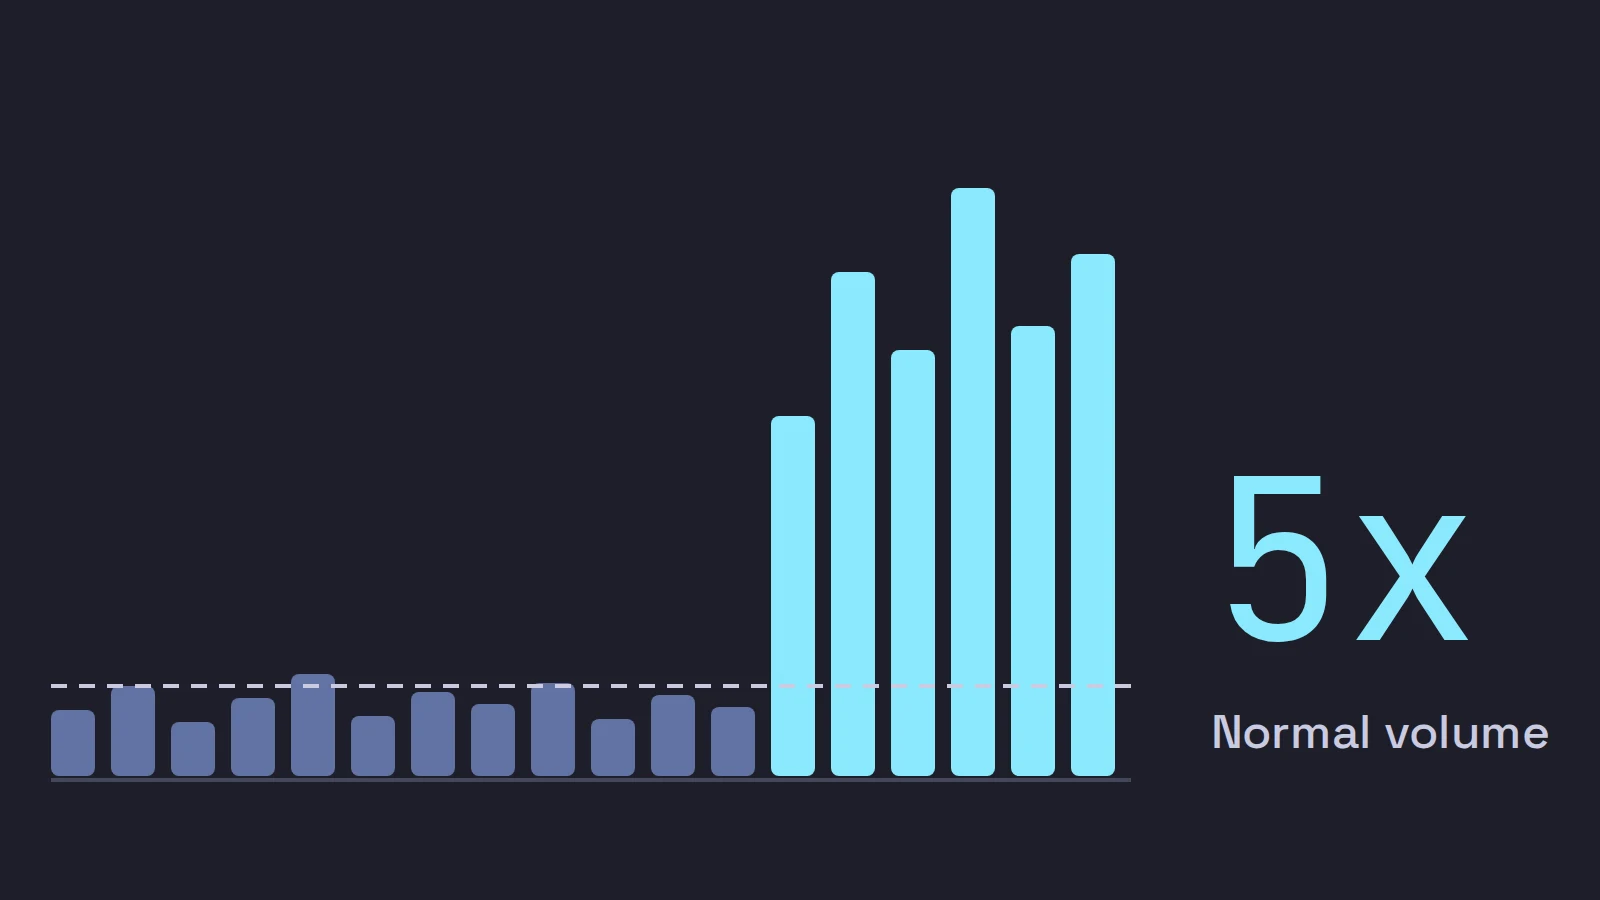
Relative volume (RVOL) is a stock's volume now divided by its normal volume. The simple version divides today's volume so far by the average daily volume; the time-of-day version divides it by the average volume traded by this time of day. An RVOL of 1 is a normal day, 2 is twice normal, and small-cap momentum traders usually want 5 or more. Read the simple version against the clock, and be wary of high RVOL on a stock that barely trades normally.
A stock up 30% tells you something happened. Relative volume tells you whether anyone cares. It is the quickest way to separate a stock in play, one that far more traders than usual are buying and selling today, from a stock drifting up on a few hundred shares. This post covers what relative volume is, the two ways to compute it and why they disagree, the thresholds momentum traders use, what the research says, and the traps.
What is relative volume?
Relative volume compares volume today with volume on a normal day for the same stock. It is a ratio, so it works across stocks of any size: 3 million shares is nothing for a large cap and an enormous day for a small cap, but RVOL of 6 means the same thing for both. Six times the usual number of shares are changing hands.
That is why it sits next to price change on every momentum screen. Brad Barber and Terrance Odean showed that individual investors are net buyers of attention-grabbing stocks, including stocks with abnormally high trading volume (Review of Financial Studies, 2008). High RVOL is attention you can measure. It does not tell you direction, only that the crowd has arrived.
How to calculate RVOL: simple vs time-of-day
There are two common definitions, and scanners rarely say which one they use.
| Simple (cumulative) RVOL | Time-of-day RVOL | |
|---|---|---|
| Formula | Today's volume so far / average daily volume | Today's volume so far / average volume by this time on past days |
| Average over | Commonly 30 to 90 days | Commonly 10 to 20 days |
| At 07:30 ET | Starts near zero and climbs | Can be huge on a real gapper |
| At 15:30 ET | Close to its final value | Close to the simple version |
| Needs | Daily volume history | Intraday volume history |
IBKR's Hot Contracts by Volume scan is the simple kind: it ranks stocks by today's volume divided by a 30-day exponential moving average of daily volume. Scalpel's RVOL column is also the simple kind, against IBKR's 90-day average daily volume.
Time-of-day RVOL needs more data but answers a better question. A 2024 working paper by Carlo Zarattini, Andrea Barbon and Andrew Aziz computes it for the opening range as the first five minutes' volume divided by the average first five minutes over the previous 14 days (SSRN 4729284). Same idea, any window: compare like with like.
A worked example
All numbers are for a fictional stock, ABCD, with an average daily volume of 400,000 shares.
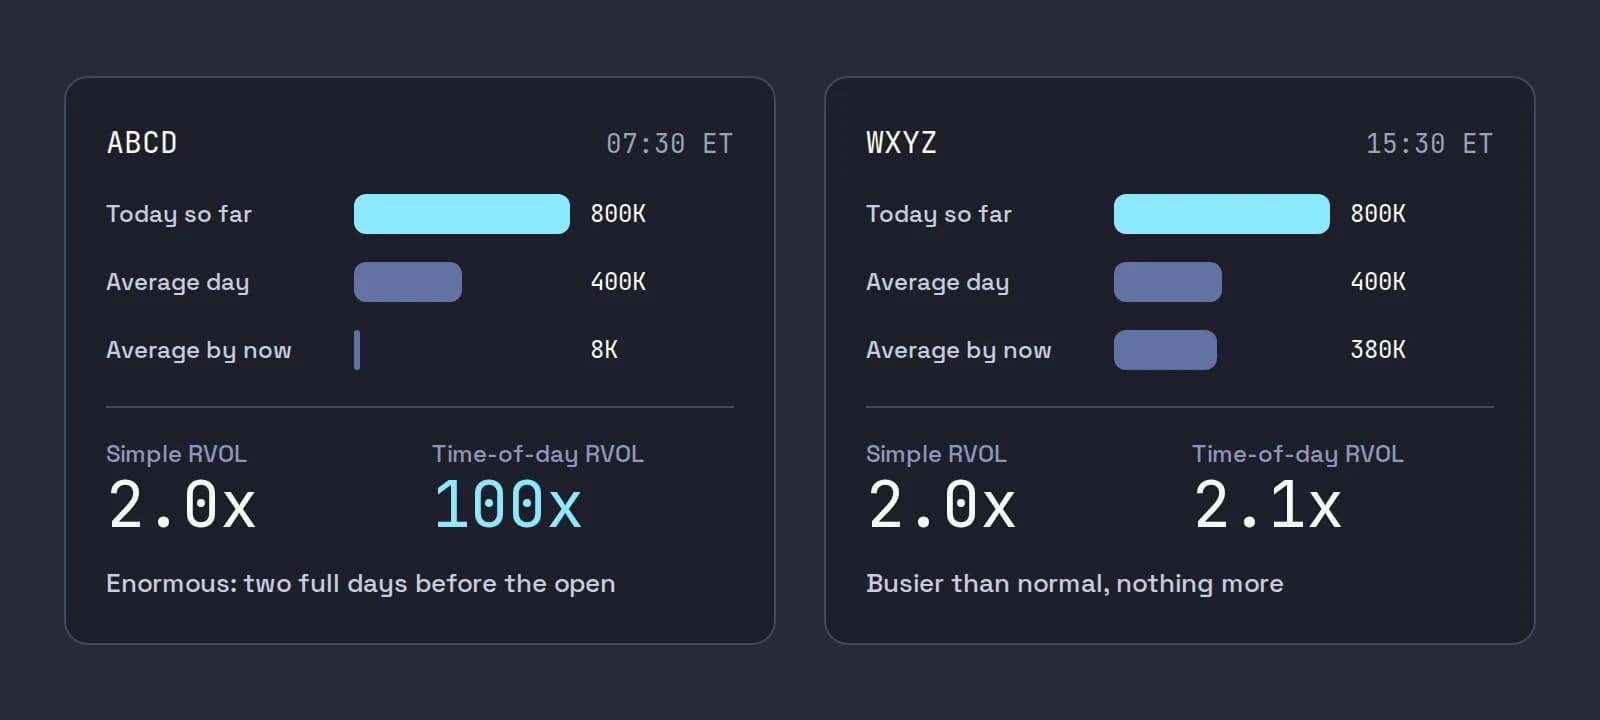
At 07:30 ET, ABCD has traded 800,000 shares in the pre-market on contract news.
- Simple RVOL: 800,000 / 400,000 = 2.0x.
- Say ABCD normally trades 8,000 shares by 07:30. Time-of-day RVOL: 800,000 / 8,000 = 100x.
Both are correct. The simple number says "two full days of volume before the open", which is enormous. The time-of-day number says the same thing more loudly. The mistake is to read 2.0x at 07:30 as "only twice normal".
At 15:30 ET, a different stock, WXYZ, has traded 800,000 shares against the same 400,000 average. Simple RVOL is again 2.0x, and this time it is unremarkable. If WXYZ normally trades about 380,000 shares by 15:30, its time-of-day RVOL is 800,000 / 380,000 = 2.1x: busier than normal, nothing more.
The reason the clock matters is that volume is not spread evenly through the day. Prem Jain and Gun-Ho Joh documented on the NYSE that average volume differs significantly across the hours of the trading day (Journal of Financial and Quantitative Analysis, 1988), and the pattern is still the familiar one: heavy at the open, light at midday, heavy into the close. Before the open it is lighter still. NYSE's research put the pre-market at 7.1% of all US equity share volume in the second quarter of 2025. So a stock that trades its whole normal day before 09:30 is doing something far outside its usual pattern.
Relative volume thresholds
These are conventions, not laws. What counts as high depends on the time and the stock.
| RVOL | What it usually means | For a momentum trader |
|---|---|---|
| Under 1x | A quieter than normal day | Not in play |
| 1x to 2x | Normal to busy | Usually not in play |
| 2x to 5x | Real interest | Worth a look if there is news and a clean chart |
| 5x and up | Far more traders than usual | The common momentum threshold |
| 10x and up | A stock in play | The day's main runners often live here |
Remember which RVOL you are reading. 5x simple RVOL at 09:00 ET is exceptional. 5x time-of-day RVOL at 09:00 is good but common on news days.
What the research says about RVOL
The clearest public test of relative volume as a filter is the Zarattini, Barbon and Aziz paper above. In a backtest of a five-minute opening range breakout on US stocks from 2016 to 2023, the average trade was -0.02R when the opening range RVOL was below 100%, 0.08R above 100%, and 0.38R above 30x, net of a $0.0035 per share commission. R is the planned risk per trade, so 0.08R means 8 cents of profit per dollar risked, on average.
Read it carefully before you lean on it:
- It is a backtest, not trading results. The paper models commissions, but we found no allowance for slippage or the bid-ask spread, which matter most in exactly the fast stocks RVOL points you to.
- The universe is not small caps. It required a price above $5, at least 1 million shares a day on average and a daily range above $0.50, so most low-float runners are excluded.
- One author runs a trading education business. Andrew Aziz is listed with Peak Capital Trading and Bear Bull Traders; Andrea Barbon is at the University of St. Gallen. It is a working paper, not a peer-reviewed result.
What it supports is modest and useful: the same entry rule did better on stocks trading far above their normal volume. That is the reason momentum traders filter on RVOL at all. It does not say high-RVOL stocks go up.
Relative volume pitfalls
The low average volume trap. RVOL of 10x on a stock that averages 20,000 shares a day is 200,000 shares. That is a lot for that stock and not much for you: one 5,000 share order can still move it several cents. Always look at the raw volume next to the ratio. A floor such as 100,000 shares traded today, which many momentum scans use, handles most of this.
A short history. A recent listing, or a stock that just came back from a long halt, has few days to average. Its RVOL can be wildly high or meaningless.
Last week's spike is in the average. A 30-day average that includes a 20-million-share day from last Tuesday is inflated, so today's RVOL reads lower than it should. An exponential moving average forgets that spike faster than a simple one.
Halts. A stock in a trading pause trades zero shares, so its RVOL stalls exactly when interest is highest.
Different scanners, different numbers. One scanner's 5x and another's 5x can be a different average length, a different average type, or simple vs time-of-day. Learn what yours computes, then stick to one.
Using a relative volume scanner
In TWS, run Hot Contracts by Volume beside Top % Gainers with the same price and volume filters: one finds the movers, the other ranks them by how unusual their volume is. Top Volume Rate, the highest volume per minute, catches a stock as it starts to move. The IBKR momentum scanner setup covers these scans in full, and free stock scanners compares the free options, many of which show RVOL on delayed data.
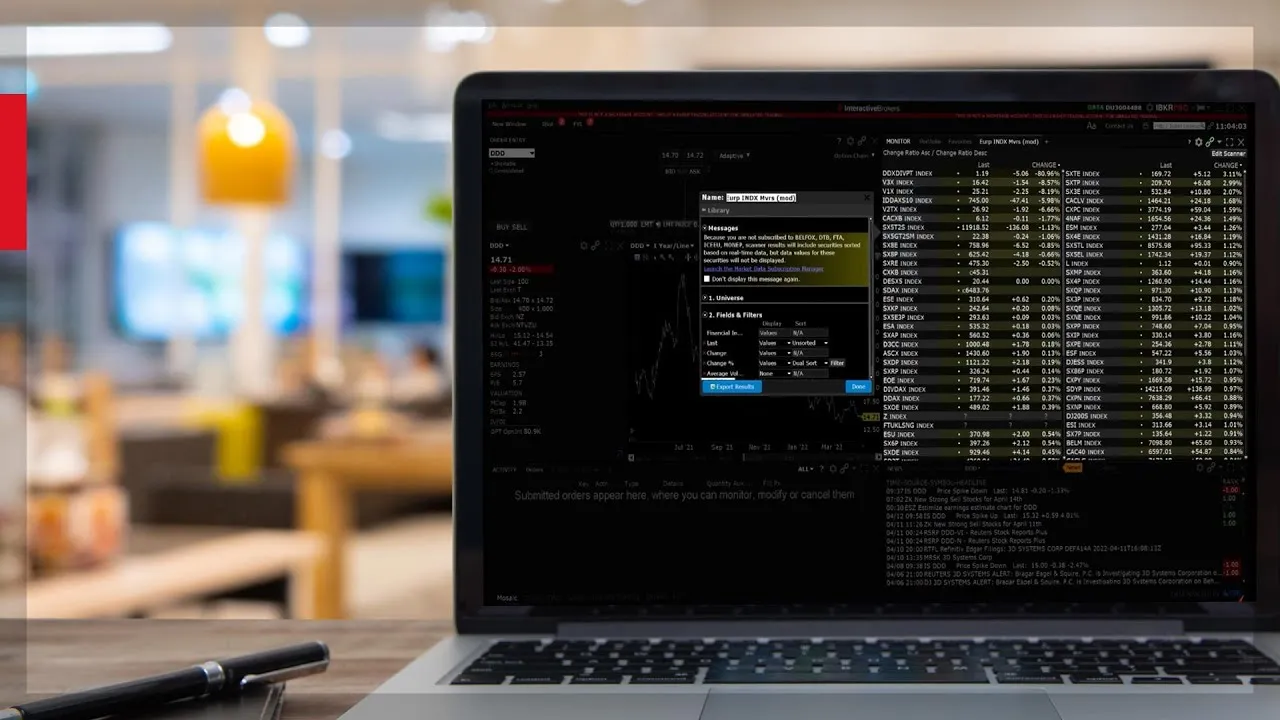
If you have not built a scan in TWS before, IBKR's own lesson on Mosaic market scanners shows how to pick a scan type, add price and volume filters and save it, which is all these volume scans need.
RVOL is one of five checks, not a signal. A stock with high RVOL, no news and 80 million shares outstanding is busy, not necessarily in play. Pair it with a catalyst (news catalysts for day trading), the supply (low float stocks) and the morning routine in how to find pre-market gappers. Momentum day trading puts the five together.
Where Scalpel fits
Scalpel shows two different relative volumes, on purpose.
- The RVOL column on every scan panel is today's volume against IBKR's 90-day average daily volume, the simple kind, updated tick by tick from your own IBKR quotes. It starts low before the open and climbs, so read it against the header clock (glossary: relative volume).
- Running up's Min rel volume (x) is a burst measure: this second's volume against its average over the last 30 seconds, 5 by default. Combined with a 2% rise in about a minute, it shows the moment a stock starts to run, whatever its daily RVOL.
Our scanner video shows both on a live scan desk:
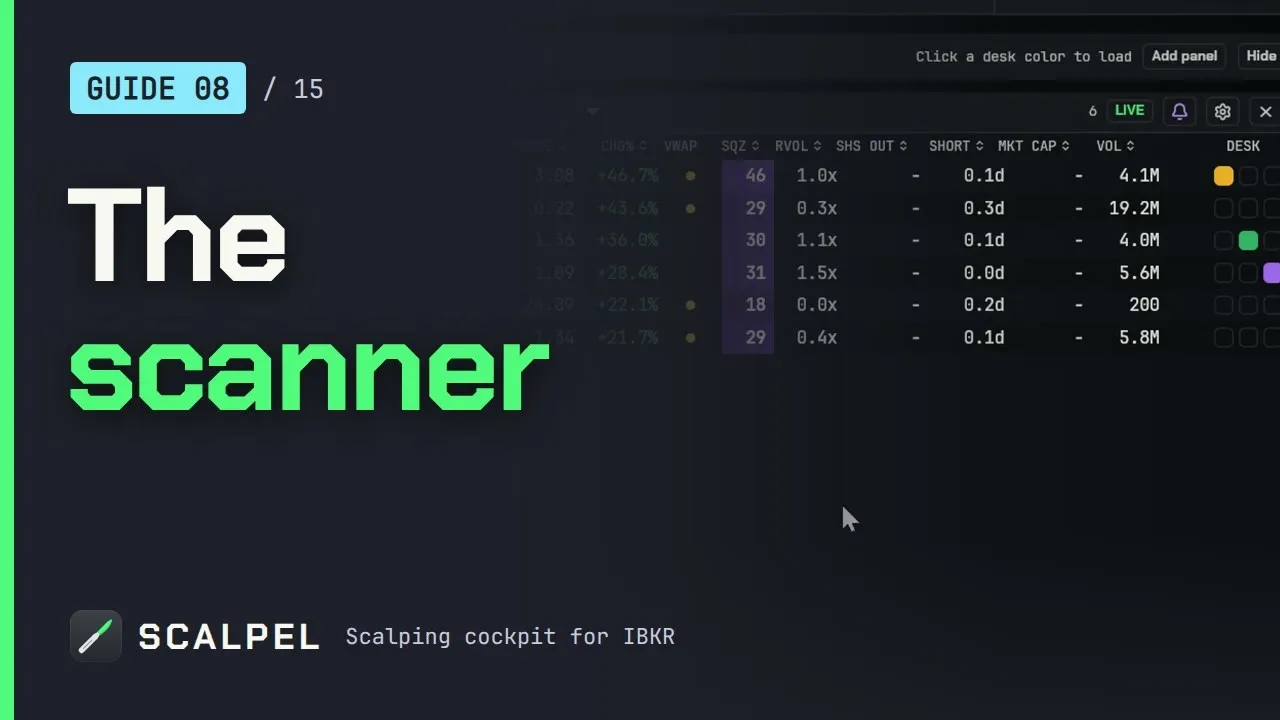
Scanner panels covers sorting by RVOL and the other columns, and scan types explains the Running up filters. Scalpel does not compute time-of-day RVOL: if that is the number you trade by, a scanner that offers it is the better choice for that job.
Trading carries a significant risk of loss. Nothing here is financial advice. IBKR scan definitions and research checked on October 22, 2026.
Questions
- What is a good relative volume for day trading?
- Small-cap momentum traders commonly look for 5 times normal or more, and the day's biggest runners often trade at 10 times or more. Read it against the time of day: 2x simple RVOL at 07:30 ET is far more unusual than 2x at 15:30.
- How is relative volume calculated?
- Divide volume by normal volume. Simple RVOL is today's volume so far divided by the average daily volume, often over 30 to 90 days. Time-of-day RVOL divides by the average volume traded by the same time on past days.
- What does RVOL 2 mean?
- The stock has traded twice its normal volume. With simple RVOL that means twice a whole average day so far; with time-of-day RVOL it means twice what it normally trades by this time.
- Why is RVOL low in the pre-market?
- Most scanners use simple RVOL, which compares volume so far with a whole average day. Before the open only a fraction of a normal day has traded, so the number starts low and climbs. A pre-market stock at 1x or 2x is already very active.
- Does high relative volume mean a stock will go up?
- No. It means far more traders than usual are involved, in both directions. It is a filter for where to look, not a signal to buy.
Related guides
Guide 8.5Arrange scan panelsAdd, remove, resize and drag scan panels, change their scan, switch LIVE and LOG views, mute the bell, send a row to a desk, and every option in the cog.Guide 8.2Scan types: momentum, running up and setupsWhat Scalpel's high-of-day momentum, running up and setups scans find, the running up filters, setup letter chips, and when each scan announces a name.Guide 15.1Day trading glossaryPlain definitions of the day trading and Scalpel terms used in these guides, from Level 2, VWAP and R multiples to float, borrow, dilution and LULD halts.
Keep reading
- Momentum day trading: how small-cap momentum worksMomentum day trading explained: what makes small caps move, the shape of the day, entries, exits and risk, and what the research says about the odds.
- Momentum trading on Interactive Brokers: scanner setup for gappersInteractive Brokers momentum trading starts with the scanner: TWS settings for pre-market gappers, which scans to run, and how to live without a float filter.
- Small-cap momentum trading on Interactive Brokers: what you needSmall-cap momentum trading on Interactive Brokers: what the Warrior Trading review says, and how to get scanning, hotkeys, fixed risk and pre-market stops.
Practice in SIM, against the live book.A lifetime license, every update included, with a 7-day refund guarantee.Ask in DiscordGet Scalpel