How to find pre-market gappers each morning
By Scalpel Team. , updated . 8 min read.
In short
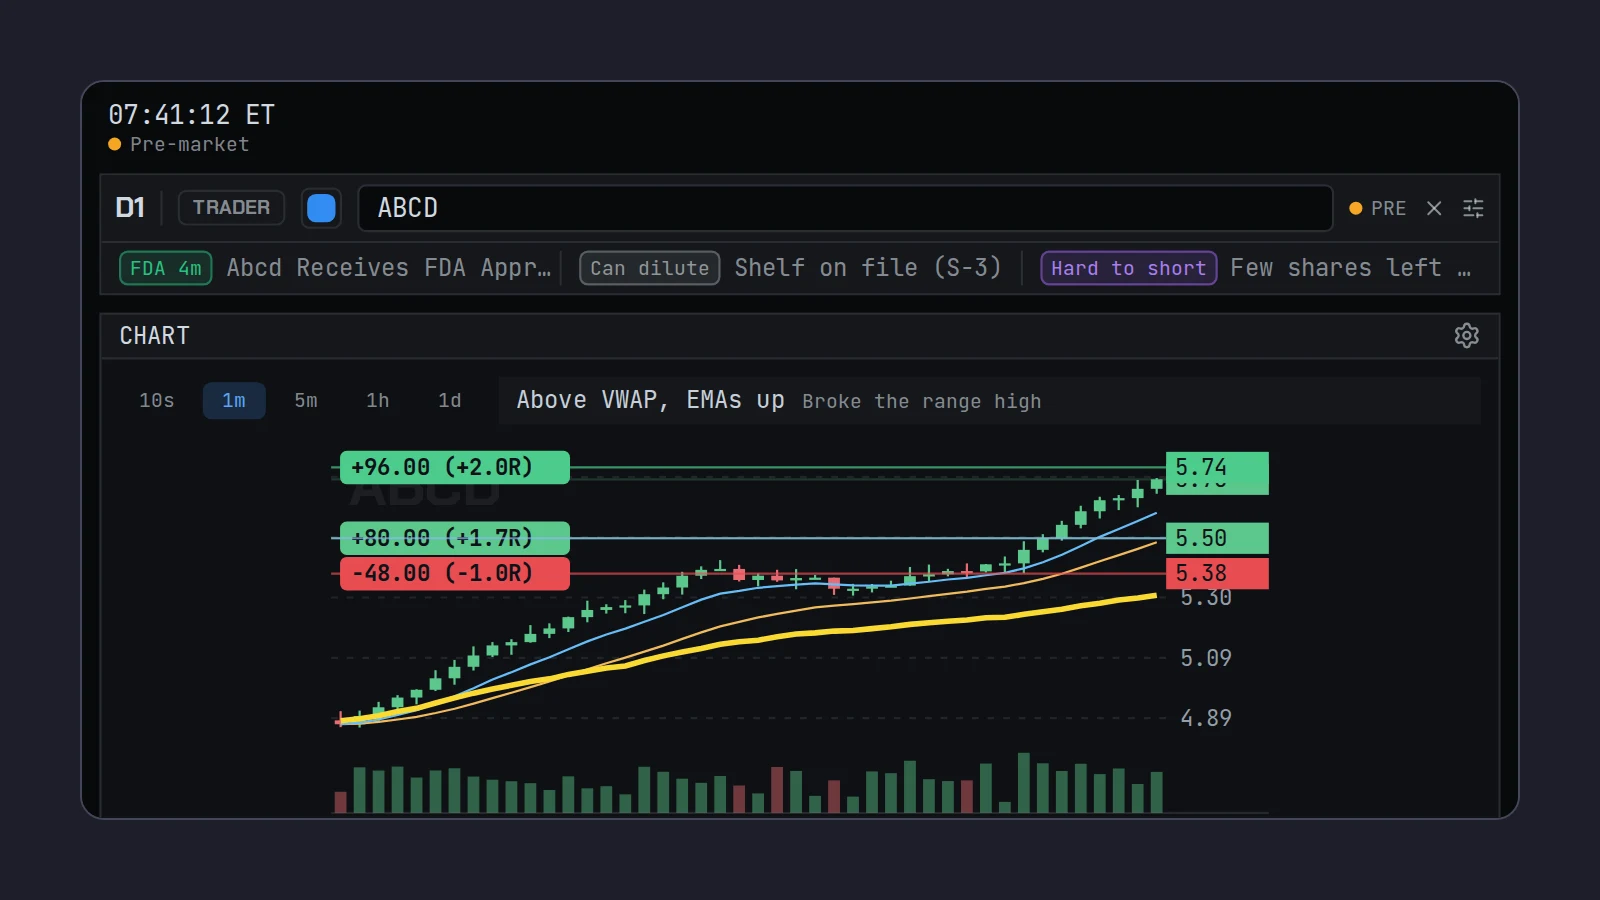
Pre-market gappers are stocks trading well above yesterday's close before the 09:30 ET open. To find them, run a scanner that ranks US stocks by percent change from the previous close (IBKR calls it Top % Gainers) from 04:00 ET, filtered to roughly $1 to $20, up 10% or more and a volume floor that rises through the morning. Then check each name for a catalyst, its share supply and dilution, and cut the list to two or three by about 09:15.
Every momentum morning starts with the same question: what is moving, and why. Premarket gappers are the answer to the first half. This guide covers how a gap is measured, the scanner settings that find gapping stocks without burying you in noise, the four checks that turn a list of fifty into a watchlist of three, and a 07:00 to 09:30 ET routine you can run with TWS alone.
Scalpel is independent and not affiliated with or endorsed by Interactive Brokers.
What a pre-market gap is
A gap is the distance between yesterday's close and where the stock trades now. Before the open, every trade is a pre-market trade, so the "gap" on a pre-market gap scanner is simply the percent change from the previous close:
Gap % = (last price - previous close) / previous close x 100
A worked example with a fictional stock. ABCD closed at $2.97. At 07:40 ET it trades at $4.10. That is $1.13 above the close, and 1.13 / 2.97 = 38%. ABCD is a 38% gapper.
There is a catch with scan names. IBKR defines Top % Gainers as the stocks whose last price shows the biggest percent increase from the previous night's close, which works before the open. Top Close-to-Open % Gainers measures from the previous close to today's opening price, so it returns nothing until 09:30: there is no opening price yet. If your "gap scanner" is empty at 08:00, that is usually why.
Why the pre-market is a different market
The pre-market looks like the regular session with fewer people. It is more different than that.
- It is busier than it used to be, and early. NYSE's research found that pre-market trading reached 7.1% of all US equity share volume in the second quarter of 2025, up from 3.0% in 2023, and that more than 30% of pre-market volume now trades before 07:00. Six US equity exchanges open at 04:00.
- It is cheap shares and retail. The same report puts the pre-market at only 2.5% of the dollar value traded, and says almost 8 out of every 10 non-S&P 500 shares traded in NYSE Arca's pre-market involve a retail trader on one side.
- It is thin and jumpy. The SEC's bulletin on extended-hours trading warns of lack of liquidity, price volatility and larger quote spreads, and that pre-market prices may not reflect where the stock trades at the open.
- Prices move on information. Michael Barclay and Terrence Hendershott found that individual trades carry more information outside regular hours and that price changes before the open are larger and less noisy than after the close (Review of Financial Studies, 2003). Pre-market moves are not random noise. They are also not always right.
On IBKR, US stocks also trade in an overnight session from 20:00 to 03:50 ET, so a stock that gapped on evening news may already be up when the pre-market opens at 04:00.
Pre-market gap scanner settings
These are starting values for a small-cap momentum scan. They are not magic numbers: loosen them on a slow morning, tighten them when everything is running.
| Setting | Before 07:00 ET | From 07:00 ET | Why |
|---|---|---|---|
| Sort by | Percent change from previous close | Same | That is the gap |
| Price | $1 to $20 | $1 to $20 (or $2 to $20) | Below $1 the spread eats you; above $20 a 10% move needs far more money |
| Percent change | 5% or more | 10% or more | Early lists are short; later you want only real movers |
| Volume | 10,000 or more | 100,000 or more | Drops stocks showing a big gap on a few hundred shares |
| Exchanges | Major US exchanges, no OTC | Same | OTC names are hard to trade fast |
| Max results | 25 to 50 | 25 to 50 | More rows than you can read is noise |
The volume floor is the one people get wrong. A stock up 60% on 4,000 shares is not a gapper; it is two traders and a wide spread. By 08:30 ET, a gapper worth watching has usually traded several hundred thousand shares, often more than its whole normal day. Relative volume (RVOL) explains how to read that against the clock.
How to find gapping stocks with TWS
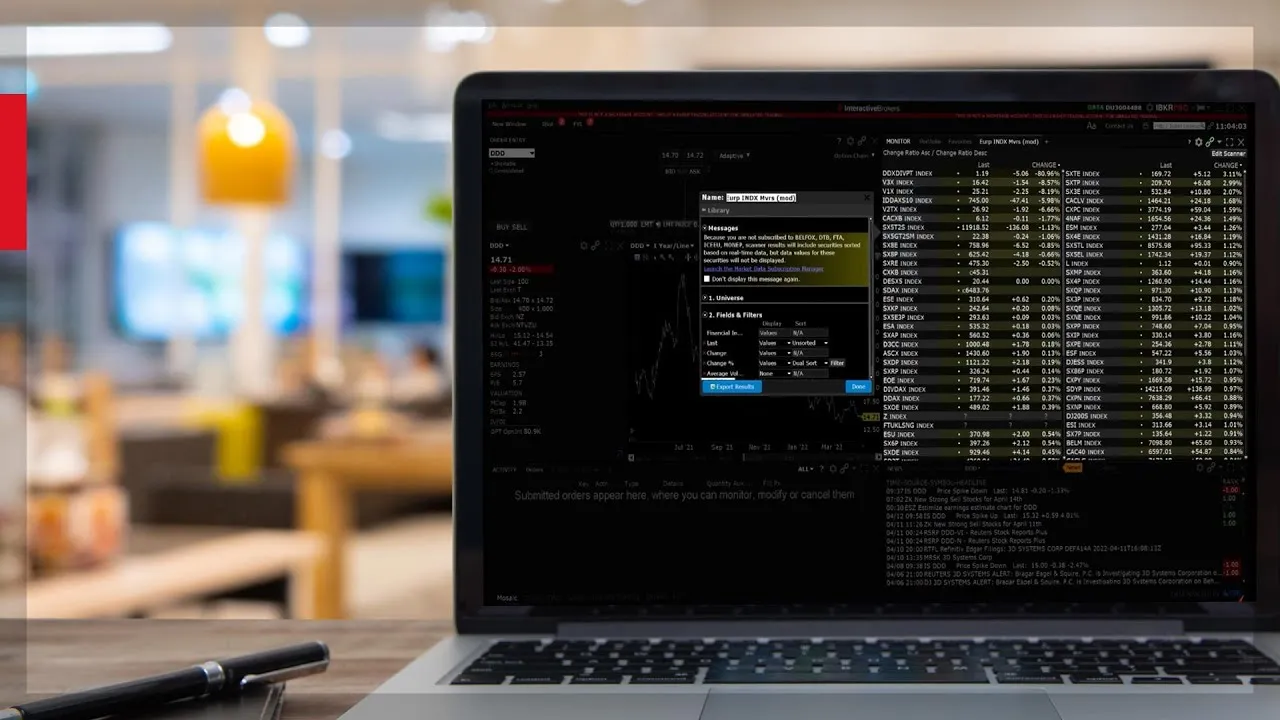
TWS's Advanced Market Scanner does the job at no extra cost beyond your market data. In short: open it (Mosaic: New Window > Advanced Market Scanner), choose US stocks on the major exchanges, pick Top % Gainers, add the price, change and volume filters above, click Search and tick Auto Refresh. IBKR says scanner data updates every 60 seconds and most scans return the top 50 by default. Momentum trading on Interactive Brokers: scanner setup has the full step-by-step, the other scan types worth running beside it, and how to live without a float filter.
IBKR's own lesson walks through building and saving a scanner in Mosaic, which is worth eight minutes if you have never set one up:
The four checks on every gapper
The scanner tells you what is moving. Four checks tell you whether it is worth your attention. Do them in this order, because each one is quicker than the next and kills more names.
1. Why is it moving?
Open the news for the row. A real catalyst, such as FDA news, trial data, a contract or a buyout, gives buyers a reason to keep buying after the open. No headline at all is a warning, not a reason. An offering headline means the company is selling stock into the gap. News catalysts for day trading grades the headline types.
2. Is the volume real?
Compare pre-market volume to the stock's normal daily volume. ABCD at 1.2 million shares by 07:40, against a 400,000 share average day, has traded three normal days before the open. That is real interest.
3. How much stock is there?
Look up the float or, as a free stand-in, shares outstanding from the latest 10-Q or 10-K on SEC EDGAR. The float is never larger than shares outstanding, so a small number there means a small float. Low float stocks explains why supply matters so much.
4. Can the company sell into it?
Check EDGAR for a recent S-3 shelf registration, a 424B prospectus or an at-the-market offering. A company with a shelf in place can sell stock into your gap, and often does. Checking dilution lists what to look for.
A worked cut, all fictional. At 08:15 ET the scan shows six names. ABCD (+38%, contract news, 1.2M shares traded, 4.5M shares out, no shelf) passes every check. EFGH (+52%, no news, 90,000 shares) fails at check one. JKLM (+24%, earnings beat, 2M shares, 60M shares out) is real but slow. NOPQ (+71%, trial data, 3M shares traded, an S-3 filed last month) is the one to watch with the most suspicion. RSTU and VWXY are leveraged ETFs, not company stocks at all: strike them. You end with ABCD and NOPQ.
Top gainers premarket: what the list hides
A top gainers list is a ranking, not a recommendation. Watch for these:
- Single-print highs. On a thin book, one 100-share print can set the pre-market high. A level made of one print is weaker than one tested several times.
- Halted names. A stock in a volatility halt can sit at the top of the list with no trading. IBKR's Halted scan shows them.
- Old news. A stock gapping on a headline from yesterday afternoon has been traded for twelve hours already.
- Things that are not small caps. Leveraged ETFs and large caps moving on index news can fill the top of an unfiltered list.
A 07:00 to 09:30 ET pre-market checklist
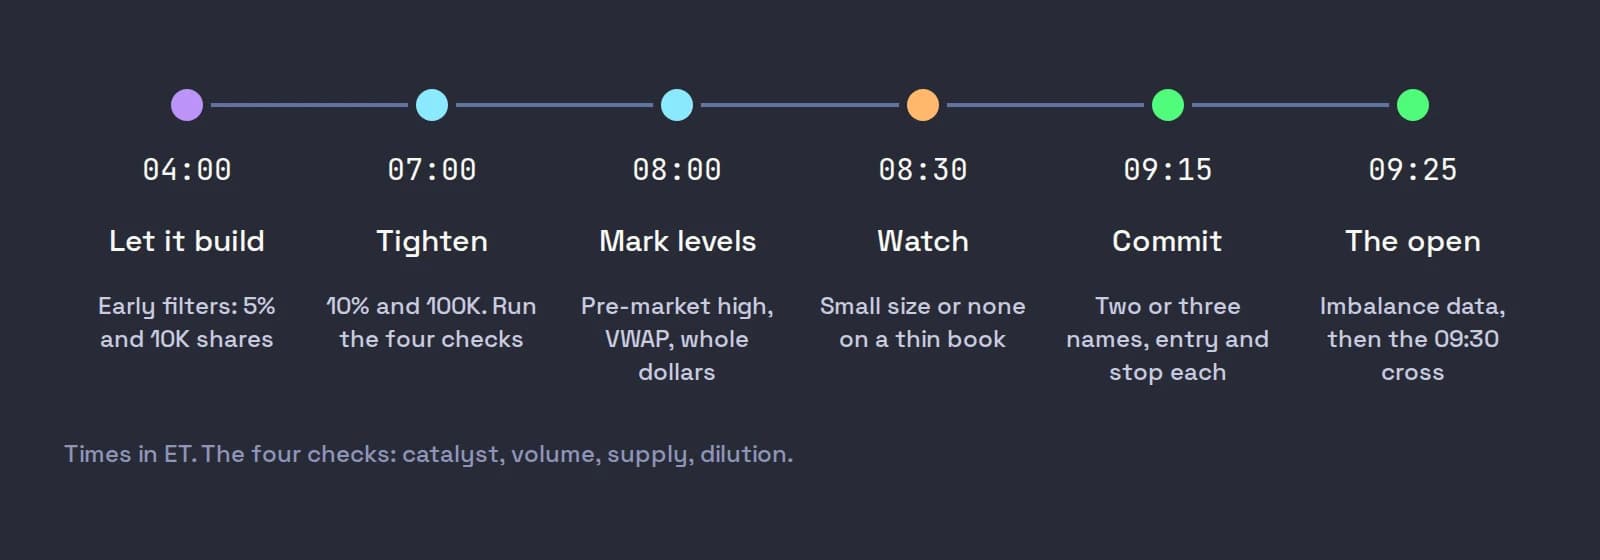
- 04:00 to 07:00: let the list build. Run the scan with the early settings. Note any big overnight movers and read their news.
- 07:00: tighten. Change floor to 10%, volume floor to 100,000. Do the four checks on every name left.
- 08:00: mark levels. For your top three, mark the pre-market high, VWAP, yesterday's high and any whole or half dollar the stock is pressing against.
- 08:30 to 09:15: watch, small or not at all. Many momentum traders trade the pre-market with reduced size or not at all, because the book is thin and exits can fill far from the stop.
- 09:15: commit to a plan. Two or three names, with the entry you want and where your stop goes for each.
- 09:25 to 09:30: the open. Nasdaq publishes opening imbalance information from 09:25 and runs the opening cross at 09:30. Expect the list to reshuffle and the gap scans that measure to the open to fill.
What you do at the open is a strategy question. Gap and go covers the most common one: buying the break above the pre-market high. If you trade before 09:30 on IBKR, your orders must be limit orders allowed to fill outside regular trading hours; IBKR extended hours trading covers those settings. For how gappers fit into the wider style, see momentum day trading.
Where Scalpel fits
Scalpel runs IBKR's own scanner over the TWS API, from 04:00 ET, so there is no scanner service or extra data feed to pay for. It merges top gainers, 3 minute volume spikes, halted, hot by volume and gappers into one list, with the same filters (out of the box: up to 30 US stocks between $0.10 and $100, up at least 10%). Price, change and RVOL on each row come from your own IBKR quotes, tick by tick, between IBKR's refreshes of about 30 seconds (set up the IBKR scanner).
The four checks are on the row: a catalyst chip with the kind of news and its age, dilution chips from SEC filings, and SHS OUT, shares outstanding from SEC filings, as the float stand-in.
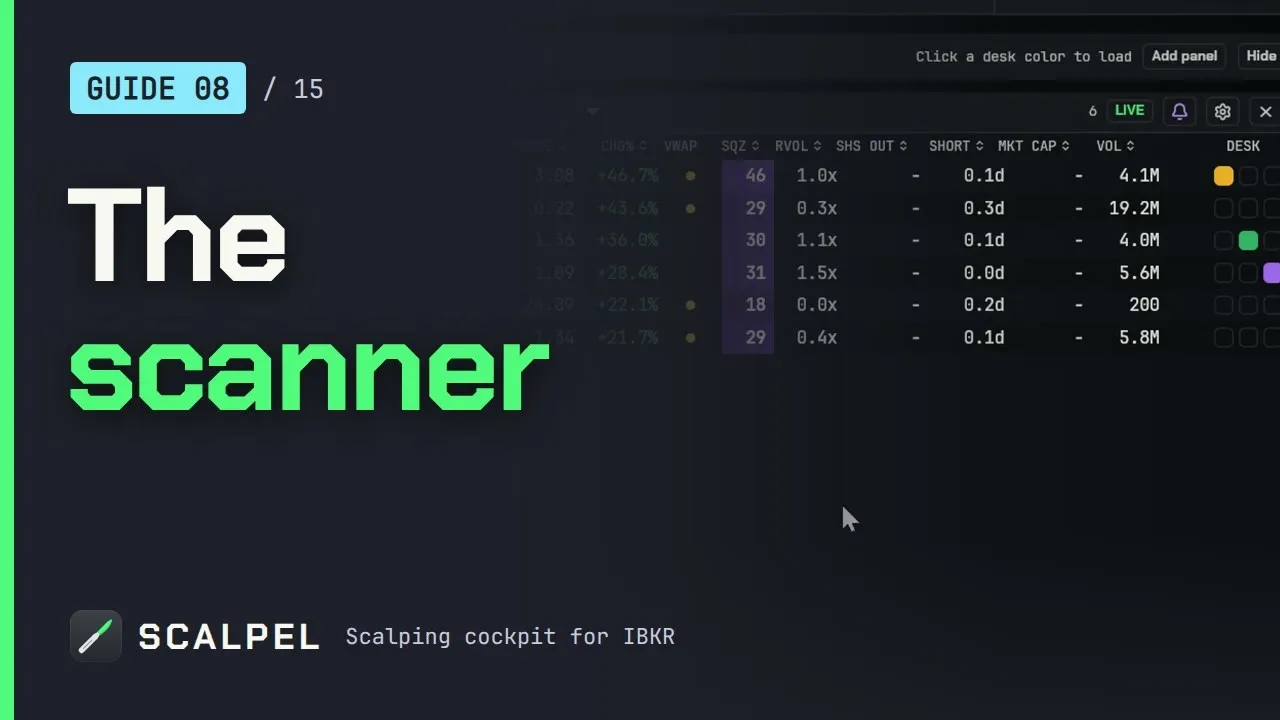
Our scanner video shows the panel from the pre-market into the open:
Pre-market scanning in Scalpel covers which scans run before 09:30, scan types covers the high of day, Running up and Setups scans, and the pre-market routine is the full morning with times. Where TWS is better: if you want hundreds of rows, other markets or fundamentals filters, its scanner is far broader. Scalpel scans US stocks for long momentum only.
Trading carries a significant risk of loss, and pre-market trading adds thin books and wide spreads. Nothing here is financial advice. IBKR, NYSE and Nasdaq details checked on October 22, 2026.
Questions
- What time do pre-market gappers start showing?
- From 04:00 ET, when the pre-market session opens, and on IBKR a stock can already be moving in the overnight session from 20:00 ET. Lists are short before 07:00 and fill in as volume builds.
- What is a good pre-market gap percentage for day trading?
- Small-cap momentum traders commonly filter for stocks up 10% or more from the previous close, dropping to 5% before 07:00 ET when lists are thin. The gap alone is not enough: it needs volume and a reason.
- How much pre-market volume is enough?
- A common floor is 100,000 shares from about 07:00 ET. Better is to compare pre-market volume with the stock's average daily volume: a stock that has already traded its normal day's volume before the open has real interest.
- Why is my gap scanner empty before the open?
- Scans that measure the gap to today's opening price, such as IBKR's Top Close-to-Open % Gainers, have nothing to measure until 09:30 ET. Use a percent change from previous close scan, such as Top % Gainers, until the open.
- Do pre-market gappers keep going after the open?
- Some do, many do not. Pre-market prices are set on thin volume and may not hold once regular-hours liquidity arrives. A catalyst, heavy volume and no dilution improve the odds but do not guarantee anything.
Related guides
Guide 8.3Scan the pre-marketScan pre-market movers from 04:00 ET in Scalpel: what the gainers, volume spike and gap scans show before the open, gap and go, and what changes at 09:30.Guide 14.2A pre-market routine with ScalpelA step-by-step routine from 04:00 ET to the open: connect, scan for gappers, check dilution and borrow, load your desks and set your risk before the bell.Guide 8.2Scan types: momentum, running up and setupsWhat Scalpel's high-of-day momentum, running up and setups scans find, the running up filters, setup letter chips, and when each scan announces a name.
Keep reading
- Momentum day trading: how small-cap momentum worksMomentum day trading explained: what makes small caps move, the shape of the day, entries, exits and risk, and what the research says about the odds.
- Momentum trading on Interactive Brokers: scanner setup for gappersInteractive Brokers momentum trading starts with the scanner: TWS settings for pre-market gappers, which scans to run, and how to live without a float filter.
- Small-cap momentum trading on Interactive Brokers: what you needSmall-cap momentum trading on Interactive Brokers: what the Warrior Trading review says, and how to get scanning, hotkeys, fixed risk and pre-market stops.
Practice in SIM, against the live book.A lifetime license, every update included, with a 7-day refund guarantee.Ask in DiscordGet Scalpel