How to read Level 2: a plain guide for day traders
By Scalpel Team. , updated . 13 min read.
In short
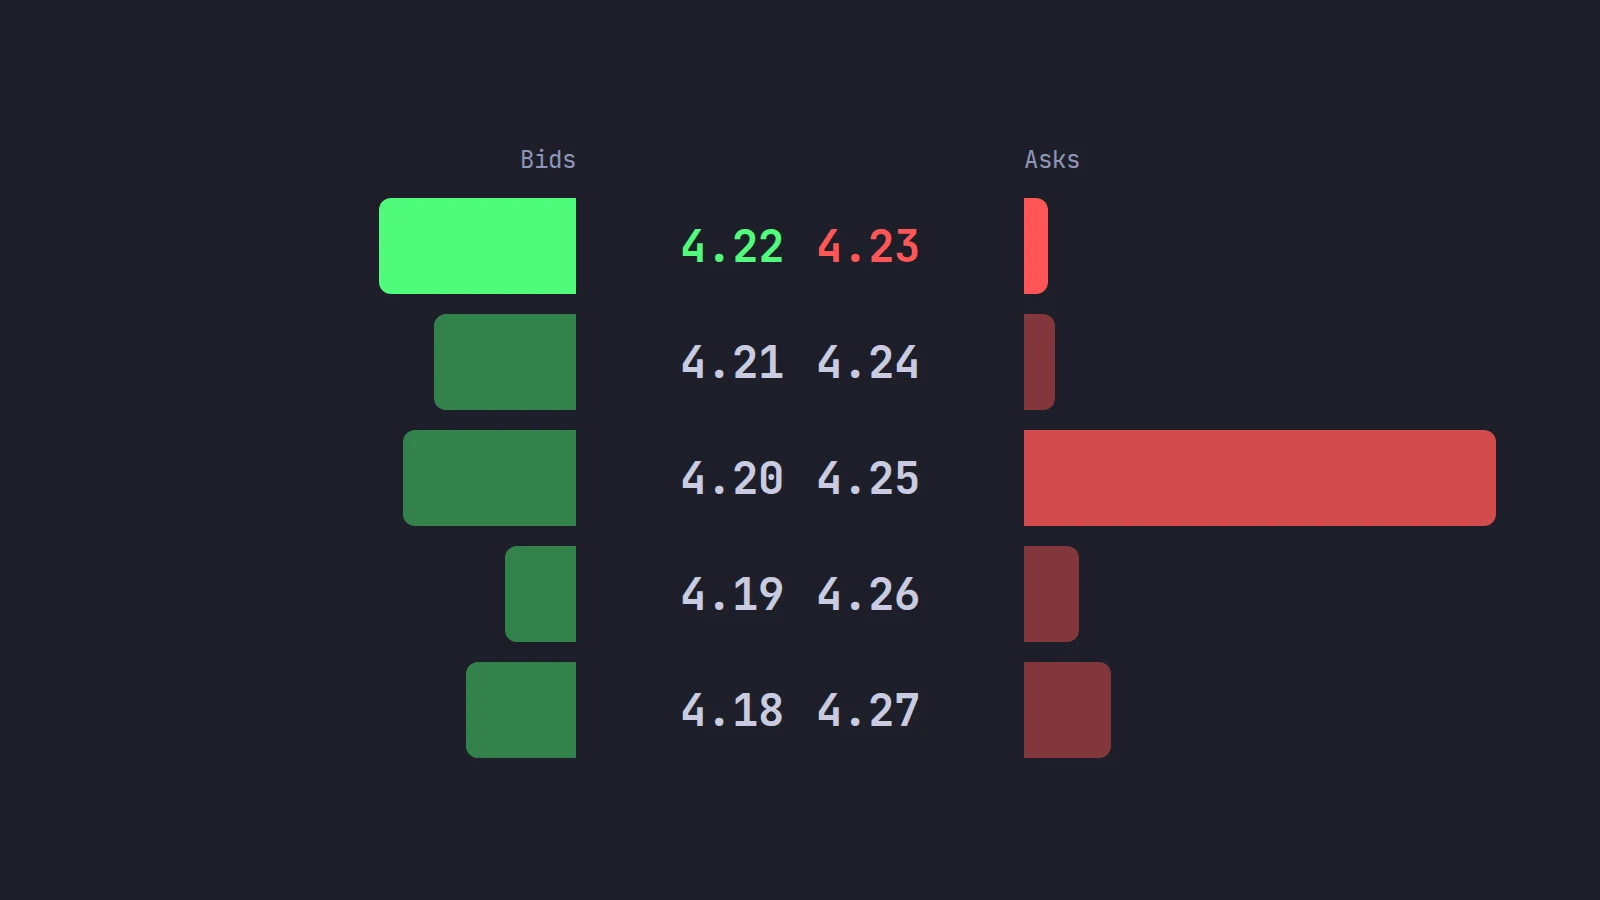
How to read Level 2: start at the inside: the best bid, the best ask and the spread between them. Then count the shares stacked on the first three or four price levels on each side, find the size that stands out, and watch the time and sales tape to see which side is actually trading. Notice how size behaves as price reaches it: does it hold, refill or vanish? Before you buy, check the bid under you, because that is your exit. Level 2 shows displayed orders on the exchanges you pay for, not hidden or off-exchange volume, so use it to judge cost, room and liquidity, not to predict direction.
Level 2 looks like a wall of flickering numbers the first time you open it. It gets easier once you know the four or five questions it can actually answer, and the ones it cannot. This guide covers how to read Level 2 the way a scalper uses it: the layout, the spread, stacking and thinning, reading the book against the tape, what is missing from it, and why the pre-market book misleads.
If you trade through Interactive Brokers and want to know which depth feeds to buy and what they cost, that is a separate question, covered in IBKR Level 2: which subscription, what it costs and how to read it. This post is about reading the book, whatever platform draws it. Scalpel is independent and not affiliated with or endorsed by Interactive Brokers.
Level 2 explained: what the book shows
Level 1 is the top of the book: the best bid, the best ask, their sizes and the last trade. Level 2, also called market depth or the order book, is everything behind that: every displayed limit order waiting at each price, on each side, with its size and the venue it rests on.
Most Level 2 screens use the same layout, often called a montage:
| Part | What it means |
|---|---|
| Left side (bids) | Buy limit orders, best (highest) price at the top |
| Right side (asks or offers) | Sell limit orders, best (lowest) price at the top |
| Price | The limit price of the orders on that row |
| Size | Shares displayed at that price on that venue. Some platforms show it in round lots of 100, so "5" means 500 shares |
| MMID or venue | Who is showing the quote. On most modern books this is the exchange, such as NSDQ or ARCA, not a firm |
| Color bands | Many platforms give each price level its own color, so you can count levels at a glance |
Each row is one venue's displayed size at one price. Three exchanges bidding 4.20 are three rows. One exchange's row can also be several different traders' orders added together, which is why a row is not a person. The four-letter codes and what you can infer from them are covered in market maker IDs on Level 2.
The inside and the spread
The best bid and best ask together are the inside. The gap between them is the spread, and it is the first number to read because it is a cost you pay on every trade.
Say ABCD is 4.20 bid and 4.23 ask. If you buy at the ask and the price does not move, you can only sell at 4.20. That is 3 cents a share, or about 0.71% of the price, lost on the round trip before commissions. On 1,000 shares that is $30. A stock that is 4.22 bid and 4.23 ask costs a third of that. When a scalp is aiming for 10 or 20 cents, a 3-cent spread takes a big share of the target, so size down or pass. The bid-ask spread on small caps works through this cost in detail.
Two more things the inside tells you:
- A one-cent spread with size on both sides is a liquid, competitive stock. You can get in and out near the quoted price.
- A wide spread that keeps changing means few participants and a thin book. Every order you send will move the price against you a little. That is slippage, and slippage in day trading covers how to measure it.
How to read Level 2, step by step
This is the order we read a book in before an entry. It takes a few seconds with practice.
Read the spread
Check the gap between the best bid and the best ask, in cents and as a percent of the price. If the spread is a large share of the move you expect, size down or skip the trade.
Count the stacks near the inside
Add up the shares on the first three or four price levels of the ask, then the bid. You are asking how much stock sits between the price and the next level up, and how much buying sits under you.
Find the size that stands out
Look for a price with far more size than the levels around it: a 6,000-share offer among 300-share rows. That is where a move can slow down. It is information, not a promise: it can be cancelled before price gets there.
Watch the tape against the book
Look at time and sales. Prints at the ask that eat through the offers are buyers in a hurry. Prints at the bid with the bids stepping down are sellers. If thousands of shares trade at a price that shows only a few hundred, there is hidden size there.
Check the bid under you
Before you buy, count what you could sell into. If 2,000 shares is your size and the first three bid levels hold 900 shares, a fast exit will walk down the book.
Read it again while you hold
The book changes every second. Bids stepping up behind the price support a long. Bids pulling away while the offers thicken is the time to tighten up, not to hope.
Stacking and thinning: the shape of the book
Traders talk about the book stacking when size builds on one side and thinning when it drains away. The shape near the inside matters more than the total, because the inside is where the next trades happen.
Here is ABCD with a 4.22 bid and 4.23 ask. On the ask, 300 shares sit at 4.23, 400 at 4.24 and 6,000 at 4.25. On the bid, 2,500 shares sit at 4.22, 1,800 at 4.21 and 2,200 at 4.20.
- Room to the next level. Buyers need only 700 shares to clear 4.23 and 4.24. Then they hit 6,000 at 4.25, which is where a move may stall.
- Cost of size. To buy 1,500 shares right now you would take 300 at 4.23, 400 at 4.24 and 800 at 4.25, an average of about 4.243. That is 1.3 cents worse than the quoted ask, or $20 on the order.
- The exit. 6,500 shares sit on the first three bid levels, so a 1,500-share exit should fill near 4.22 if those bids stay.
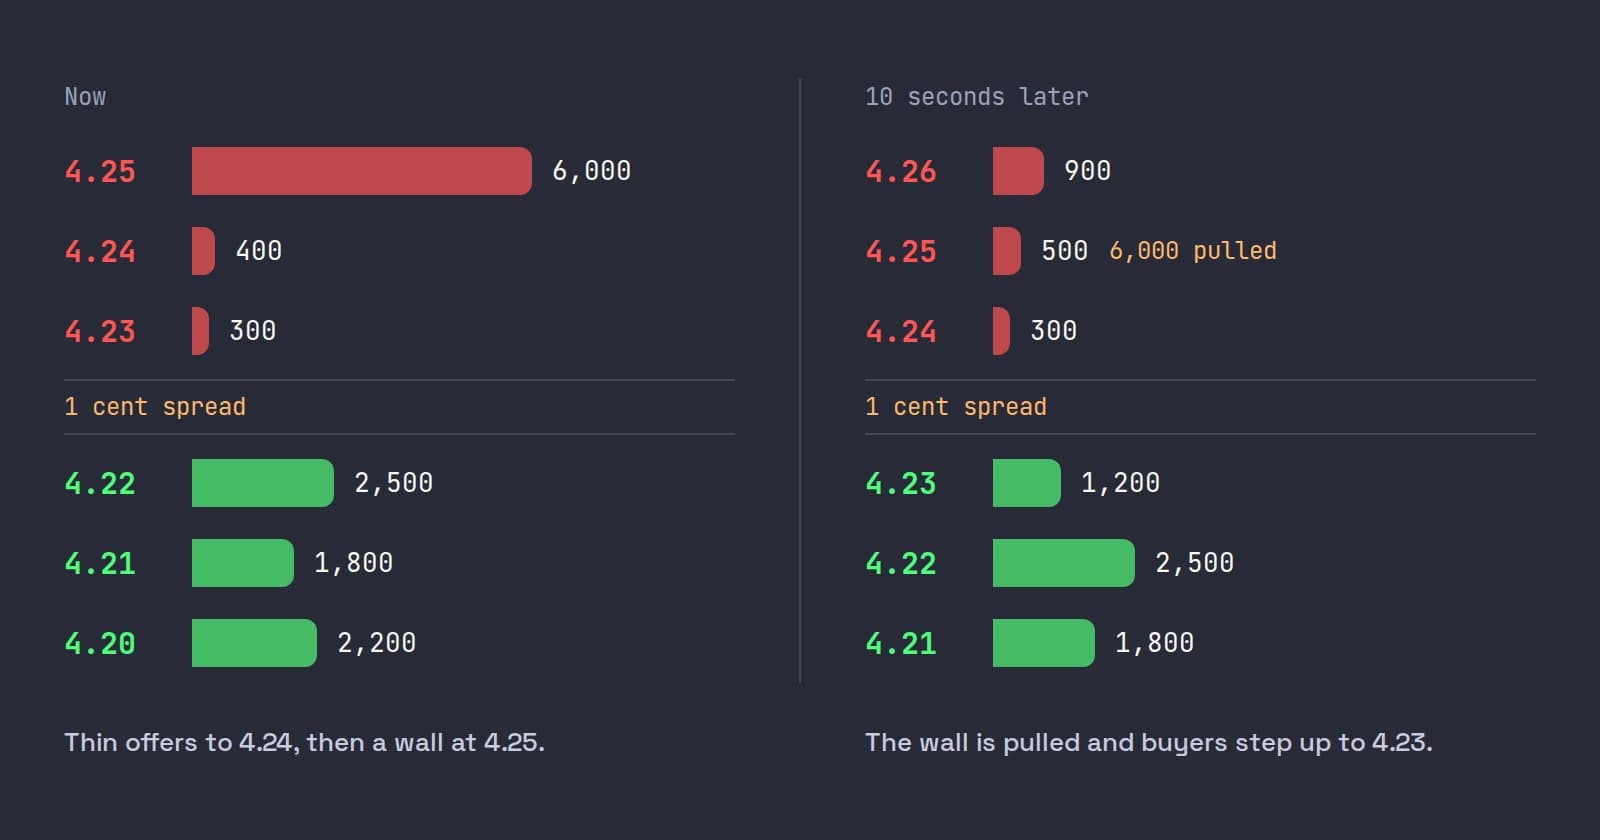
Now the same stock ten seconds later. The 6,000 at 4.25 has been pulled and only 500 shows there, buyers have bid 1,200 shares at 4.23, and the ask is 4.24 with 300 shares, then 900 at 4.26. The book thinned above and stacked below. That picture often comes before a move up, but often is not always: the 6,000 could reappear at 4.26.
Is there evidence that the near side of the book matters? Some. Using NYSE data for 50 US stocks, Cont, Kukanov and Stoikov (2014, Journal of Financial Econometrics) found that over short intervals, price changes are mainly driven by order flow imbalance at the best bid and ask, with a slope inversely proportional to market depth: the thinner the book, the further the same imbalance moves the price. Gould and Bonart (2015, arXiv working paper) studied 10 liquid Nasdaq stocks and found that the imbalance between the bid and ask queues has strongly significant predictive power for the direction of the next mid-price move, with a considerable improvement over a null model for large-tick stocks and only a moderate one for small-tick stocks.
Both papers are about the next tick, in liquid stocks, measured by machines. Neither says a stacked bid on a small cap predicts a 30-cent run. What they support is narrower: thin books move further for the same flow, and the queue at the inside tells you something about the next print. That matches how we use it: as a reason to expect a level to give way or hold for the next few seconds, never as a reason to size up.
Read the book against the tape
The book is intent. The tape is action. Orders on the book can be placed and pulled at no cost, but a trade on the tape happened. Read them together:
| Book | Tape | What it can mean |
|---|---|---|
| Bids stacked, offers thin | Buyers lifting the ask | Demand meeting little supply: room to move |
| Offers stacked | Buyers lifting the ask | A seller absorbing buying: the offer has to clear first |
| Bids stacked | Sellers hitting the bid | Buyers absorbing selling: watch whether the bids hold or get eaten |
| Offers stacked, bids thin | Sellers hitting the bid | Pressure down, and a poor place to be long |
The most useful single read is size that does not match what printed. If an exchange shows 200 shares at 4.25 and 4,000 shares trade there while it still shows 200, that is a refilling iceberg order: a big seller showing a small piece. Price usually cannot get through until that seller is done. Our iceberg orders guide gives the exact rule we use to flag one.
For the basics of the tape window itself, columns, colors and condition codes, see how to read time and sales. For reading speed, size and absorption in real time, see tape reading for scalpers.
Reading Level 2 in TWS
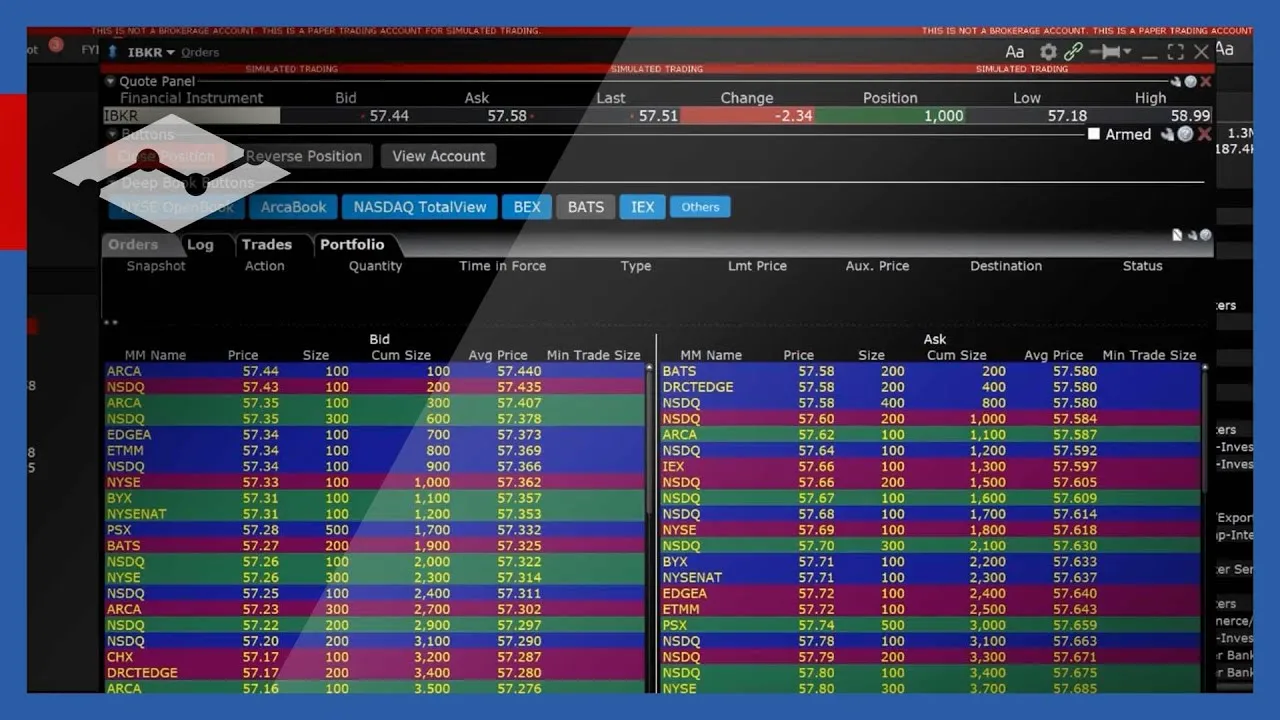
If you trade in TWS, the window built for reading is Market Depth Trader. In Mosaic, open it from New Window; in Classic TWS it is under Trading Tools. IBKR describes it as showing "the alternative bids and offers away from the inside quote" (IBKR Guides: Market Depth Trader). The Deep Book buttons along the top add each exchange's Level 2 rows, and the Others button adds Level 1 data from exchanges that do not offer deep data or that you have not subscribed to. If the book looks thin, check which buttons are on.
IBKR also limits how many books you can open: one deep book window per 100 market data lines, with a minimum of three and a maximum of 60. Over the limit, a new window falls back to aggregated top-of-book data. IBKR's own guide adds that it "cannot guarantee that every price quoted for a particular security/commodity will be displayed."
Interactive Brokers' own lesson walks through Market Depth Trader: opening it, the Deep Book buttons and placing orders from the book. It is worth nine minutes if you read depth in TWS.
What Level 2 cannot show you
This is the part most "how to read Level 2" guides skip, and it is the part that costs money.
- Off-exchange trading. Level 2 shows exchange books. A large share of US stock volume never touches them. In the SEC's figures for the first quarter of 2022, exchanges executed 59.7% of share volume in NMS stocks and off-exchange venues about 40%: wholesalers 23.9%, alternative trading systems 10.2% and other broker-dealers 6.3% (SEC Release 34-96495, Table 1). Those trades show up on the tape, never on the book. Hidden orders and dark pools covers what that means.
- Hidden and reserve size. Exchanges accept orders that display nothing, or a small piece of a larger order. You only learn about them when they trade.
- Venues you do not subscribe to. Each depth feed is one exchange's book. The SEC's list of registered national securities exchanges runs to 29 names, several of them options-only, and no retail depth package carries every equity book. Nasdaq TotalView vs Level 2 covers what one exchange's full book adds.
- Odd lots. Orders under one round lot (usually 100 shares) may not appear. IBKR's API documentation says plainly that in its market depth "odd lot orders are not included" (TWS API: market depth).
- Intent. Size on the book can be cancelled in microseconds. Some of it is placed only to be seen. Fake walls on Level 2 covers spoofing and layering, which are illegal, and the harder cases that are not.
The practical rule: trust the book for what it costs to trade right now. Do not trust it as a map of where every buyer and seller is.
Level 2 in the pre-market
Small-cap momentum traders do much of their work between 04:00 and 09:30 ET, when the book is at its least reliable:
- Fewer participants. Many market makers and funds do not quote until the open, so a book can look one-sided simply because one side has not arrived.
- Thin rows. A few hundred shares can be the whole stack at a price. One trader adding or pulling one order can move the inside several cents.
- Wide spreads. Suppose ABCD is 4.10 bid and 4.18 ask at 07:45 ET. A round trip at those prices costs 8 cents, about 2% of the price, before the stock moves at all.
- Your exit is the bid. If 400 shares bid at 4.10 and 300 at 4.06, a 2,000-share sell walks well below 4.06.
- Stops behave differently. Outside regular hours, exchanges take limit orders only, so a resting stop may not protect you. Why your stop did not trigger in the pre-market explains it.
Use the pre-market book to judge cost and liquidity. It says very little about where the stock opens.
Level 2 trading: what it is good for
Level 2 is a tool for the execution, not the idea. The idea (a stock in play, a catalyst, a level on the chart) comes first. Level 2 answers the questions that follow:
- Can I get in at a fair price? The spread and the size at the ask.
- Is there room to go? The size between the price and the next level.
- Can I get out? The size on the bid under my position.
- Is the level I care about real? Whether size there trades and stays, or vanishes as price arrives.
It is not good at forecasting. Any edge in order flow is short-lived. Chordia, Roll and Subrahmanyam (2005, Journal of Financial Economics) found that on the NYSE, the market takes more than five minutes but less than sixty to trade away the return predictability that order imbalances leave behind. Professional firms with faster data compete for whatever is left in the first seconds. A trader reading a screen by eye is not going to win that race, which is why we use the book to manage the trade, not to call it.
Your order type matters here too. A marketable limit order priced a few cents through the ask uses what the book shows you while capping what you can pay if the book moves.
Everything in this cluster
This post is the starting point for our Level 2 and the tape series. Each post below covers one question in depth:
- IBKR Level 2: which Interactive Brokers depth subscriptions to buy, what they cost, and how many books TWS lets you open.
- Level 1 vs Level 2: what top-of-book data leaves out, and who actually needs depth.
- How to read time and sales: the columns, the colors, odd lots, condition codes and dark prints.
- Tape reading for scalpers: speed, size, absorption and reading a breakout on the prints.
- Market maker IDs on Level 2: what NSDQ, ARCA and EDGX mean, and what you can and cannot infer from them.
- The bid-ask spread on small caps: the cost you pay on the way in and again on the way out.
- Spoofing on Level 2: fake walls, layering and what you can actually see.
- Nasdaq TotalView vs Level 2: whether one exchange's full book is worth paying for.
- Hidden orders and dark pools: the volume no book shows.
Where Scalpel fits
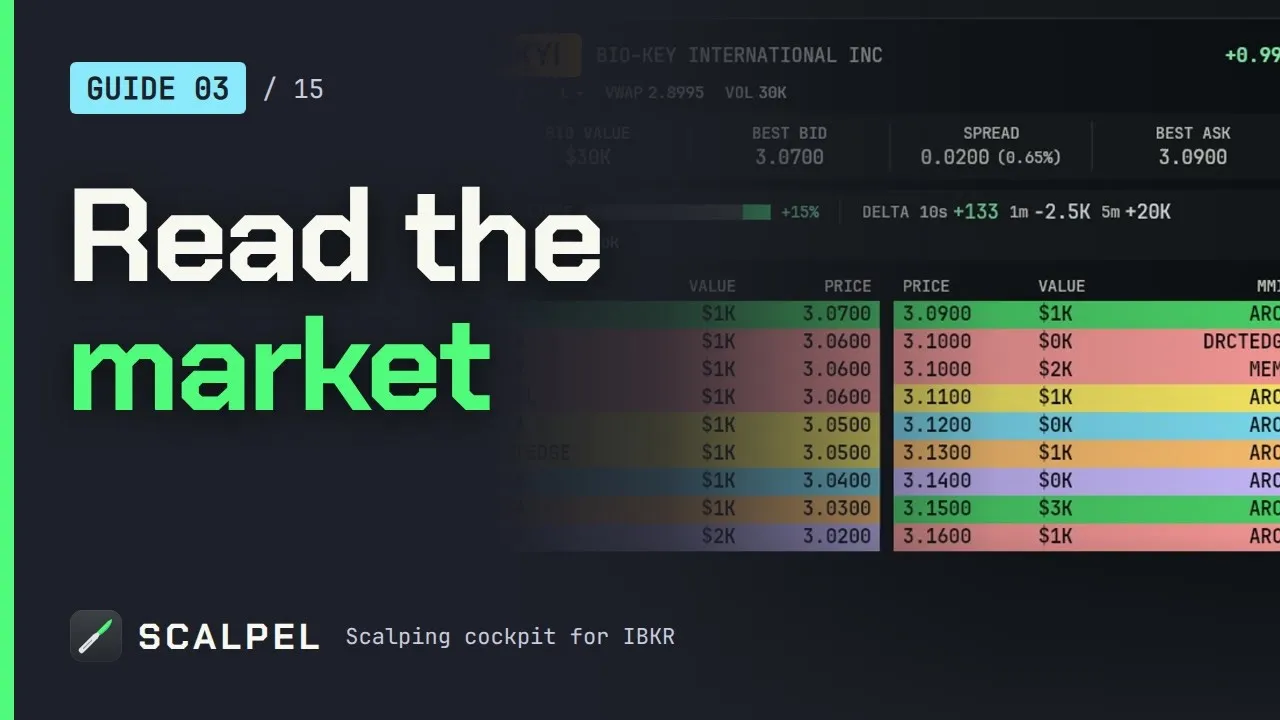
Scalpel is a desktop trading cockpit for your own IBKR account. It draws IBKR's SMART depth as a montage in the style many momentum traders learned on DAS Trader: bids left, asks right, one row per venue, with the time and sales tape beside the book. It does some of the arithmetic this guide asks you to do by eye. Above the book are the spread in dollars and percent, the total size on each side, an IMBALANCE gauge weighted toward the inside, and DELTA, shares bought at the ask minus shares sold at the bid over 10 seconds, 1 minute and 5 minutes. A refilling venue gets a layers icon once enough trades into it. The Level 2 guide explains every number on the panel, and reading the players shows each footprint as it looks on the montage.
Our short video walks through the Level 2 panel, the tape and the read line in under two minutes.
The step most traders skip is the last one: checking the bid before you buy. Switch on Thin bid exit warning in the LEVEL 2 cog and, while you hold, Scalpel walks your position down the visible bids and warns when selling it all would cost 0.6% or more against the best bid.
To be fair to the alternatives: TWS shows the same IBKR data, and Market Depth Trader is a good reading window if you trade slowly. DAS Trader Pro is the fuller platform if you want direct routing or shorting. Scalpel is narrower: long only, US stocks, and it needs the same IBKR depth subscriptions (the market data you need). Scalpel is independent and not affiliated with or endorsed by DAS Trader.
Trading carries a significant risk of loss. Nothing here is financial advice.
Questions
- How do you read Level 2 for day trading?
- Start with the spread between the best bid and ask, then count the shares on the first few price levels on each side and find any size that stands out. Watch the time and sales tape to see which side is trading, notice whether size holds or vanishes as price reaches it, and check the bid under you before you buy.
- What does Level 2 tell you?
- It shows the displayed limit orders waiting at each price on each side of the book, with their size and the venue they rest on. It tells you what it costs to trade now, how much stock sits before the next level and how much you could sell into. It does not show hidden orders or off-exchange trading.
- Is Level 2 worth it for day trading?
- For scalping thin small caps, usually yes, because the spread and the size near the inside decide your fills. For swing trading or long-term investing in liquid stocks, Level 1 quotes are enough.
- Can Level 2 predict price?
- Only weakly and only for the next tick or so. Research finds order book imbalance at the best bid and ask has some short-term predictive power, mostly in liquid large-tick stocks. Size can be cancelled instantly, so use Level 2 for cost and liquidity, not forecasts.
- Why does Level 2 change so fast?
- Orders are added, cancelled and traded continuously, many by algorithms that update in microseconds. A busy small cap can change its book many times a second, which is why the tape, showing actual trades, is the better check on what the book says.
- What is the difference between Level 2 and time and sales?
- Level 2 shows orders waiting to trade: intent. Time and sales shows trades that happened: price, size, time and venue. Reading them together tells you whether displayed size is real and which side is in control.
Related guides
Guide 3.1How to read Level 2 in ScalpelRead Scalpel's DAS-style Level 2: bids left, asks right, optional colour bands per price, venues, spread, imbalance and delta, and reading players by behaviour.Guide 3.7Read the players on Level 2: venues, refills and sizeRead who is doing what on Scalpel's DAS-style montage: venues refilling a price, big size that holds or vanishes, bids stepping up, and the honest limits.Guide 3.2Spot iceberg orders on Level 2How Scalpel flags an iceberg: one venue refilling a small size while far more trades there, the exact rule behind the icon, and why it is not a floor.
Keep reading
- IBKR Level 2: which subscription, what it costs and how to read itIBKR Level 2 explained: which depth feeds to buy and what they cost today, the TWS limit on books at once, and how to read the book, pre-market included.
- Level 1 vs Level 2 market data: what the difference means for a tradeLevel 1 vs Level 2 market data: top of book vs depth, a worked example of what your size really costs, IBKR prices, and who actually needs Level 2.
- How to read time and sales for day tradingHow to read time and sales: what each column means, the green, red and white colors, odd lots, condition codes, dark prints, and a worked read of the tape.
Practice in SIM, against the live book.A lifetime license, every update included, with a 7-day refund guarantee.Ask in DiscordGet Scalpel