Slippage in day trading: how to measure it and cut it
By Scalpel Team. , updated . 8 min read.
In short
Slippage in day trading is the gap between the price you planned to trade at and the average price you actually got. Measure it on every fill against a fixed reference (the ask when you pressed buy, your stop price on a stop-out, your target on a take-profit), and record it in R as well as cents, because on a tight scalping stop a few cents is a large share of your risk. You cut it by capping every order with a limit, trading stocks with tight spreads and real depth, sizing to the book, and planning exits before you need them.
Most traders think about slippage once, when a stop fills 20 cents below where they set it. The real damage is quieter: two or three cents on every entry and exit, every day, which never shows up as a single bad trade but can turn a small edge into a loss. You cannot see that by memory. You can see it in five minutes a week with a simple log.
This post defines slippage, shows how to measure it in cents and in R, where it comes from on small caps, and what reduces it. It is part of our order types for day trading series. Rules and fees checked on October 22, 2026. Scalpel is independent and not affiliated with or endorsed by Interactive Brokers.
What is slippage in trading?
Slippage is the difference between the price you expected when you decided to trade and the price you were filled at. A buy that fills above your reference price has slipped; so has a sell that fills below it. The SEC's Investor.gov puts the root cause in one line: a market order "guarantees that the order will be executed, but does not guarantee the execution price," and "the last-traded price is not necessarily the price at which a market order will be executed" (Investor.gov: types of orders).
Institutions have measured this for decades under the name implementation shortfall: the gap between a paper portfolio traded at the decision price and the real one traded at the fill price (Perold, 1988, The Journal of Portfolio Management). A day trader's version is the same idea, one trade at a time.
How big is it for ordinary investors? In a study published in The Journal of Finance in 2025, Schwarz, Barber, Huang, Jorion and Odean placed 85,000 simultaneous market orders across six accounts at five brokers. The mean round-trip cost ranged from 0.07% to 0.46%, excluding commissions, depending on the account (Schwarz et al., 2025). On a $5 stock, 0.46% is 2.3 cents a share per round trip, before you trade anything thin or fast. In an earlier study of every trade in Taiwan, Barber, Lee, Liu and Odean found that "virtually all individual trading losses can be traced to their aggressive orders": the orders that cross the spread and take what is offered (Barber et al., 2009, Review of Financial Studies). A scalper's entries are aggressive by design, which is why slippage deserves more attention than it gets.
Where slippage comes from
| Source | What happens | Typical size on a small cap |
|---|---|---|
| The spread | A buy at the ask and a sell at the bid lose the spread on every round trip | 1 cent on a liquid name, 5 to 10 cents or more on a thin one |
| Speed | The quote moves between your decision and your order reaching the market | Grows with how fast the stock is moving |
| Size versus depth | Your order is bigger than the first level, so it takes higher offers (or lower bids) | Grows with your size and the thinness of the book |
| Gaps | A stop fires into a drop or a halt reopening and the first bids are far below | Can be many times your planned stop |
The first three are the everyday leak. The fourth is the one that hurts, and it is covered in LULD trading halts, and in stops that fire before the open. The spread itself is explained in bid-ask spread.
How to measure slippage in day trading
Pick the reference price before the trade, by rule, so you cannot flatter yourself afterwards:
- Entries: the best ask at the moment you pressed buy.
- Stop-outs: your stop price.
- Targets and planned sells: the target price, or the best bid when you pressed sell.
Then per fill:
- Buy slippage per share = average fill price minus reference price.
- Sell slippage per share = reference price minus average fill price.
Positive numbers are costs. A negative number means you were filled better than your reference, which does happen when hidden size sits inside the spread.
A worked example in R
You plan to buy 1,000 ABCD at the 5.00 ask with a stop at 4.90. That is 10 cents of risk a share and USD 100 for the trade: 1R, one unit of risk.
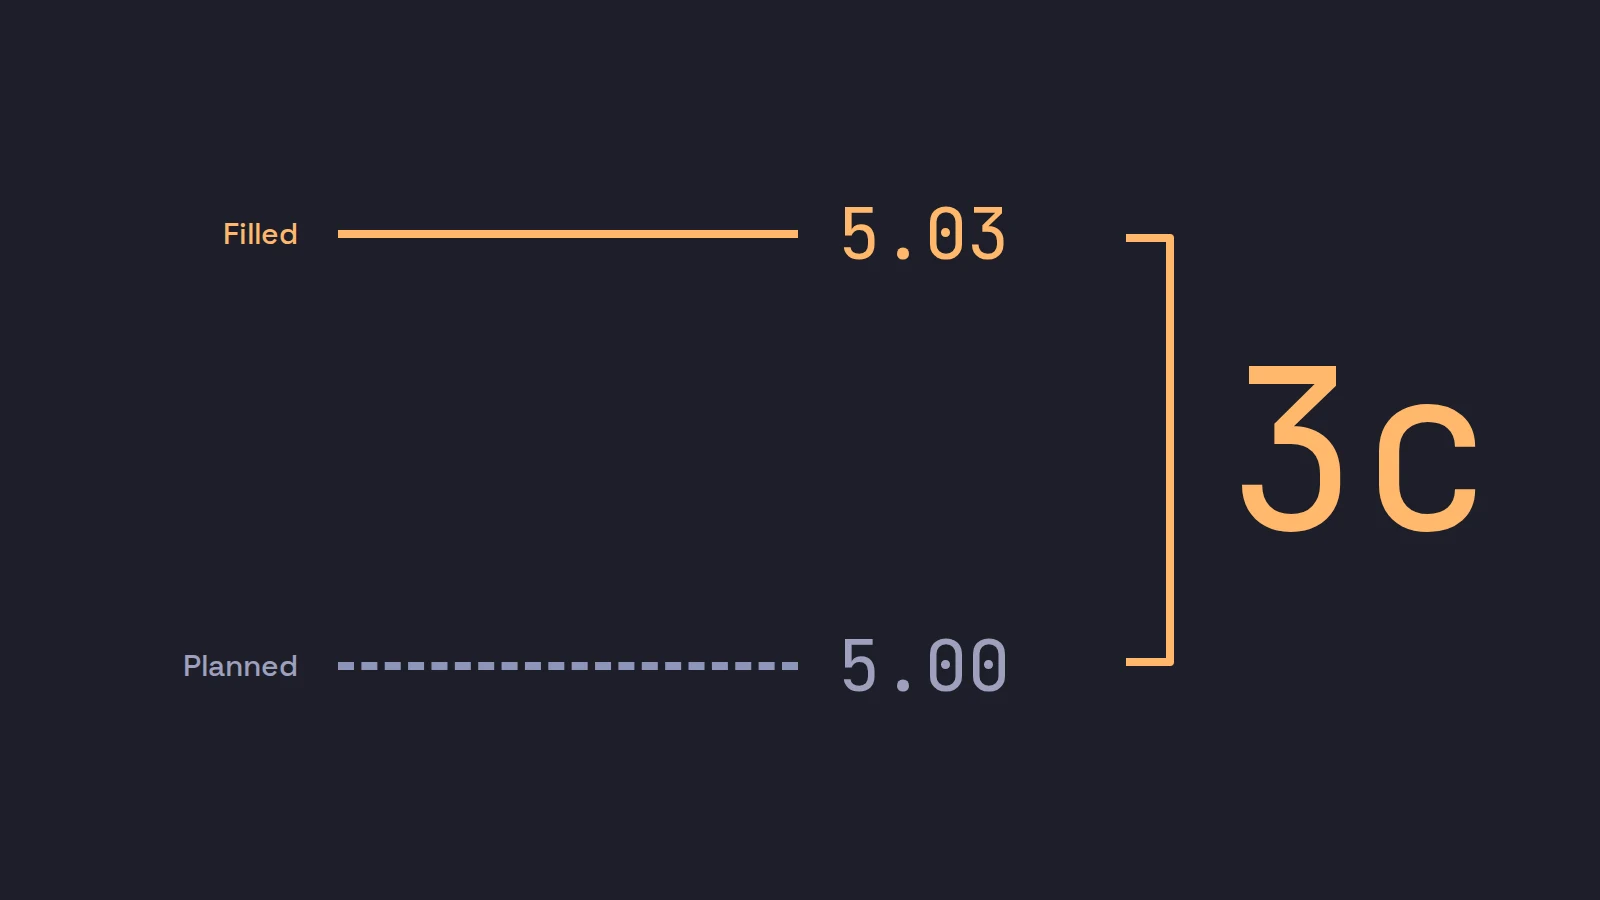
- Entry: you press buy at a 5.00 ask and fill at an average of 5.03. Slippage: 3 cents a share, USD 30, 0.3R.
- Exit: the stock trades through 4.90, your stop fires, and the sell fills at an average of 4.86. Slippage: 4 cents a share, USD 40, 0.4R.
- Result: you lose 5.03 minus 4.86 = 17 cents a share, USD 170: 1.7R, not the 1R you planned. On IBKR Pro Fixed at USD 0.005 a share (IBKR stock commissions), commission adds USD 5 each way, so the trade costs USD 180, or 1.8R.
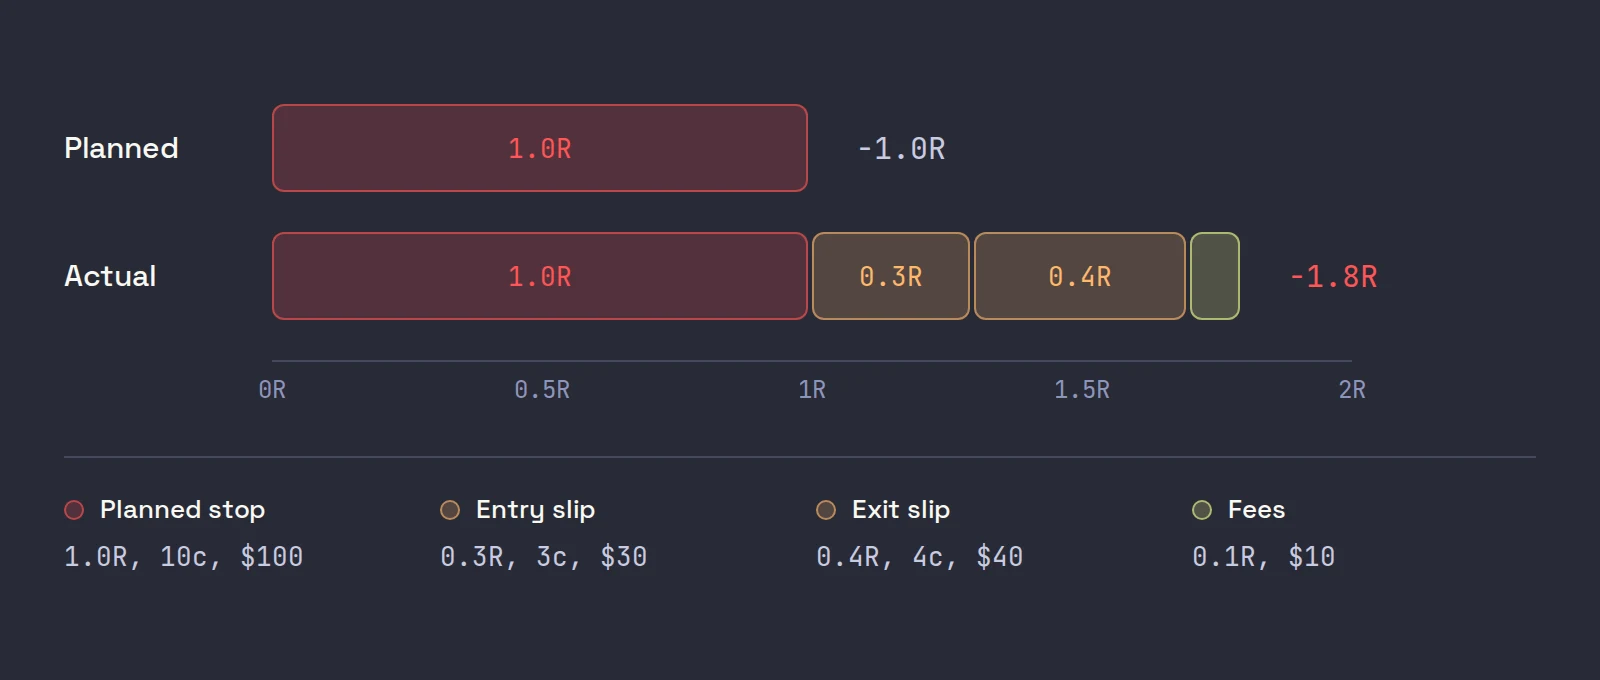
Nothing in that trade looks dramatic. Three cents in, four cents out. But a system that wins 1.5R and loses 1R on paper is a very different system if the losers average 1.7R.
Why scalpers feel slippage more
The same cents cost more R the tighter your stop is. Take 3 cents of slippage on the way in and 3 cents on the way out:
| Stop distance | Round-trip slippage | Slippage in R |
|---|---|---|
| 5 cents | 6 cents | 1.2R |
| 10 cents | 6 cents | 0.6R |
| 25 cents | 6 cents | 0.24R |
| 50 cents | 6 cents | 0.12R |
A 5-cent scalp with 6 cents of round-trip slippage cannot work, however good the read. This is the strongest argument for setting the stop where the trade is wrong and then sizing down, rather than squeezing the stop to fit a bigger size.
Slippage on small cap stocks
Low-priced, low-float stocks combine every source at once: wide spreads, thin books that refill slowly, and violent speed in both directions. Two consequences worth knowing:
- Cents are percent. A 10-cent offset is 0.5% of a $20 stock and 5% of a $2 stock. Set offsets and slippage tolerances by price, not one number for everything.
- Fees behave like slippage too. IBKR warns that SmartRouting may send a marketable order to a venue with a better price but higher fees, and that clients "should understand the ECN charges for removing liquidity when sending marketable orders for low priced stocks (under USD 2.50)" (same commissions page). On Tiered, those pass-through fees are part of your real cost per share.
If you want the case for and against market orders on these names, the numbers are in market vs limit orders on small caps.
A simple slippage log template
A spreadsheet with one row per fill is enough. The columns that matter:
| Time | Symbol | Side | Reason | Reference | Avg fill | Shares | Slip (c) | Slip ($) | Risk/share (c) | Slip (R) |
|---|---|---|---|---|---|---|---|---|---|---|
| 07:41 | ABCD | Buy | Entry | 5.00 | 5.03 | 1,000 | 3 | 30 | 10 | 0.3 |
| 07:44 | ABCD | Sell | Stop | 4.90 | 4.86 | 1,000 | 4 | 40 | 10 | 0.4 |
| 08:12 | WXYZ | Buy | Entry | 3.15 | 3.15 | 600 | 0 | 0 | 8 | 0.0 |
| 08:15 | WXYZ | Sell | Target | 3.31 | 3.30 | 600 | 1 | 6 | 8 | 0.13 |
Once a week, sort it three ways: by reason (are stops the leak, or entries?), by hour (is the 07:00 slippage worth the 07:00 moves?), and by price bucket (do sub-$3 names cost you twice as much?). The trading journal post covers the rest of what to record.
How to reduce slippage
- Cap every order with a limit. A marketable limit priced a few cents through the ask fills like a market order but sets a ceiling on what you pay. The offset is your slippage budget; decide it in advance (marketable limit orders).
- Size to the book, not to your conviction. Look at the size on the first two or three levels before you press. If your order would take all of it, you are paying the levels behind it.
- Plan the exit when you enter. A sell into a thin bid side is where slippage gets big. Scale out into strength, while buyers are there, rather than all at once into weakness (scale out and flatten).
- Avoid the worst seconds. The first prints after a halt or a news headline often come with some of the widest spreads of the day, and the LULD Plan's own annual report notes that spreads tend to be wider early in the session (LULD 2025 annual report). Let the book form.
- Trade tighter spreads. Between two setups of equal quality, take the one with a one-cent spread and real depth.
- Check your routing and plan. SmartRouting, Tiered vs Fixed and venue fees all change the real cost per share; see IBKR SmartRouting.
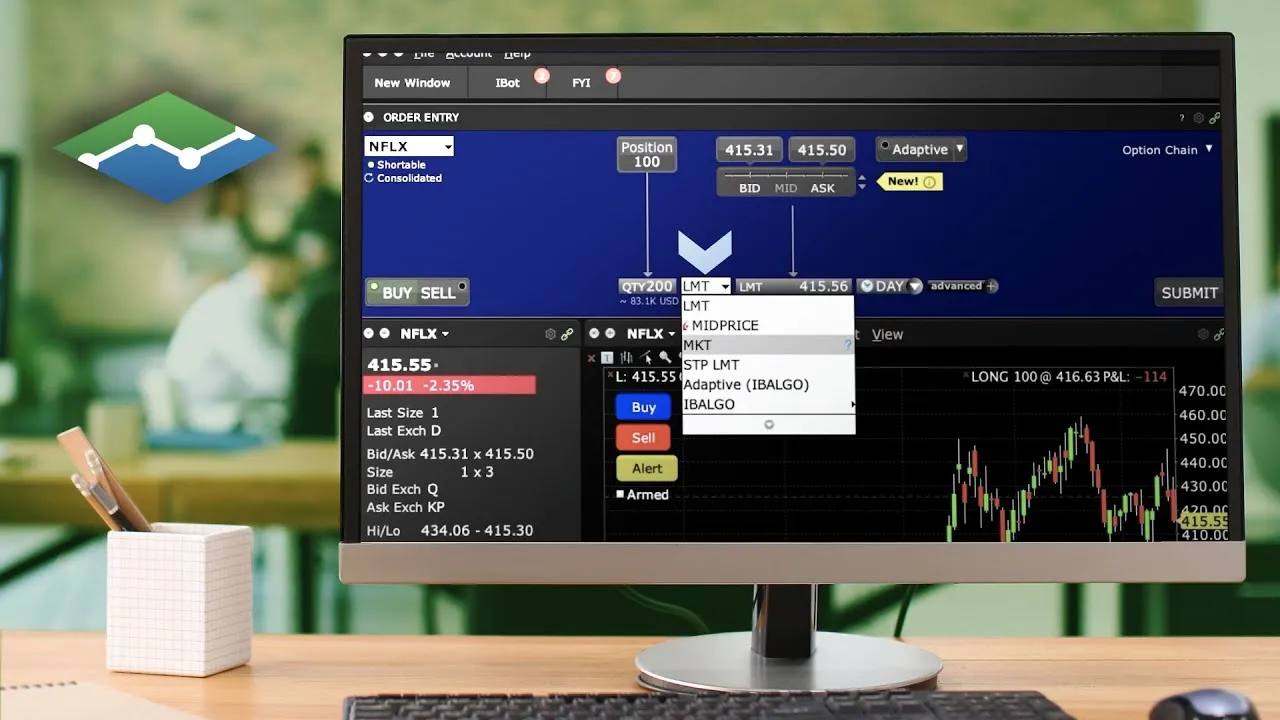
IBKR's own lesson on market orders shows the trade-off at the heart of this list: a market order buys certainty of a fill and gives up control of the price.
Where Scalpel fits
Scalpel is a keyboard-first desktop cockpit for your own IBKR account, connected through TWS or IB Gateway. It does not compute slippage for you, but it builds the habits above into the order flow:
- The offset is the cap. Every buy is a limit at the ask plus your Buy offset (10 cents by default), every sell at the bid minus your Sell offset, set in Settings > Trading or on the order bar. You fill at the prices on the book up to that limit, never beyond it (entries and fills).
- Honest paper fills. SIM fills against the live Level 2 book level by level, and SIM slippage (c) in Settings > Risk (0 to 99 cents, default 0) makes every SIM fill that many cents worse, stop-outs included. One or two cents gives a more honest paper P&L on thin, fast stocks (paper trading SIM).
- A warning before a costly exit. With Thin bid exit warning switched on in the Level 2 cog, Scalpel estimates what selling your whole position into the visible bids would cost and warns you when it is poor (read the players).
- Slippage shows up in R. The Analytics view's R distribution counts every closed trade, net of fees. Losers in the -2..-1 bucket or below -2R are trades where the stop was moved, ignored or slipped (analytics).
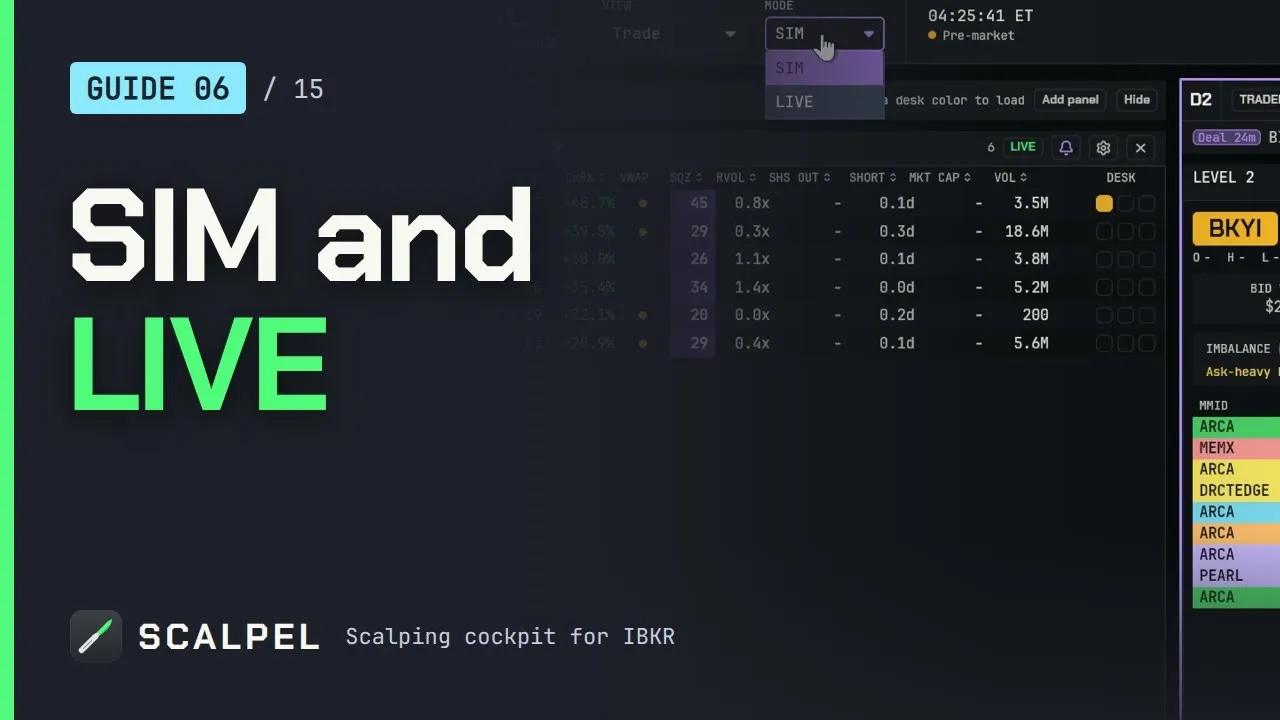
Our section video covers practising in SIM against the live book, reviewing Analytics and switching to LIVE:
Scalpel's stops are app-monitored, not resting orders at IBKR: a stop exit is a sell limit 5 cents under the last trade, re-priced if the market runs away, and it only works while Scalpel runs with a live feed (how stops work). No setting removes slippage from a fast stock.
Trading carries a significant risk of loss. Nothing here is financial advice.
Questions
- What is slippage in trading?
- The difference between the price you expected to trade at and the average price you were filled at. A buy filled above your reference price, or a sell filled below it, has slipped.
- How do I calculate slippage?
- Fix a reference price before the trade: the ask when you pressed buy, your stop price on a stop-out, or your target. For a buy, subtract the reference from your average fill; for a sell, subtract your average fill from the reference. Divide by your risk per share to get it in R.
- How can I reduce slippage when day trading?
- Use limit orders priced a few cents through the market instead of market orders, size to the shares actually showing on the first levels, exit into strength rather than into a thin bid, and favor stocks with tight spreads and real depth.
- Why is slippage worse on small cap stocks?
- Small caps often have wide spreads, thin order books and fast moves, so an order crosses more cents and walks more price levels. A few cents is also a bigger percentage of a low-priced stock.
- Do limit orders prevent slippage?
- They cap it. A limit order cannot fill worse than its limit, but a marketable limit can still fill above the ask you saw, up to the limit, and a limit that is too tight may not fill at all.
Related guides
Guide 4.4Entries: marketable limits, offsets and partial fillsHow a Scalpel buy is priced and filled: the marketable limit, the buy offset, partial fills, and why a buy is refused when the market is closed or halted.Guide 6.4Analytics: review your tradingScalpel's Analytics view: equity curve, win rate, expectancy, profit factor, R distribution, every trade, results by symbol and hour, and a trader grade.Guide 6.1Paper trading with SIMSIM fills your orders against the live Level 2 book, with partial fills, slippage and commissions. How it works, its paper ledger, and how to reset it.
Keep reading
- Day trading order types: what scalpers actually useDay trading order types: market, limit, marketable limit, stop, stop-limit and time in force, with a worked example and what scalpers really use on IBKR.
- Marketable limit order: the order type scalpers actually useA marketable limit order fills at once like a market order but caps your price. How it fills, how far through the ask to price it, and the TWS setup.
- Market order vs limit order in day trading: the small-cap costMarket order vs limit order in day trading small caps: what slippage costs in R on a thin book, why IBKR holds pre-market market orders, and what to use.
Practice in SIM, against the live book.A lifetime license, every update included, with a 7-day refund guarantee.Ask in DiscordGet Scalpel