Nasdaq TotalView vs Level 2: do day traders need it?
By Scalpel Team. , updated . 7 min read.
In short
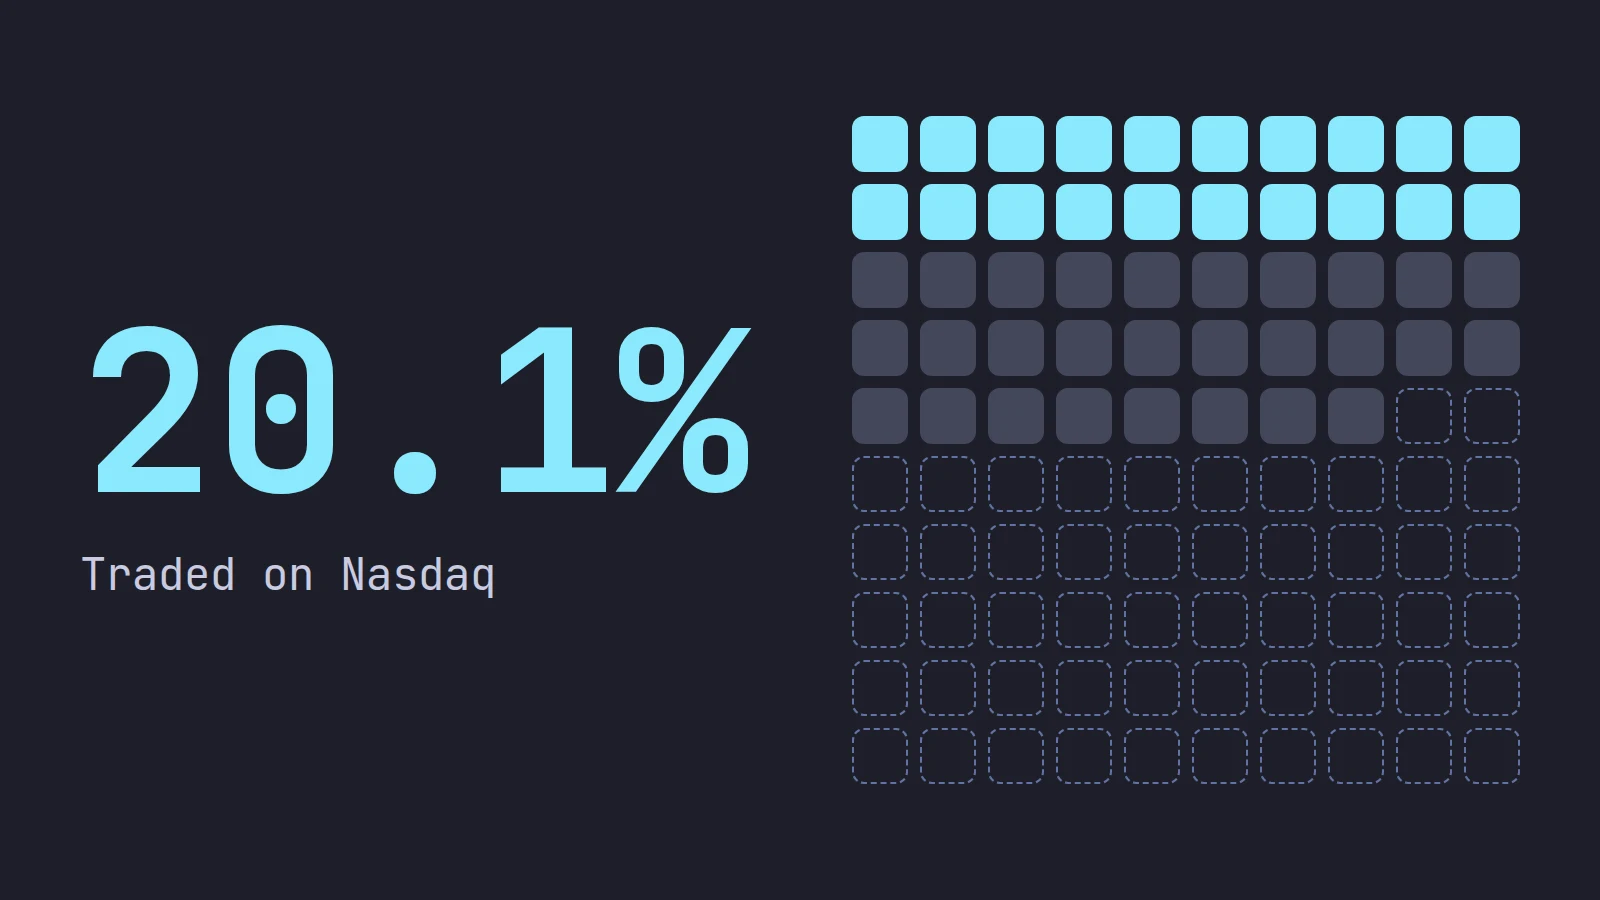
Nasdaq TotalView is Nasdaq's full depth-of-book feed: every displayed order at every price on the Nasdaq exchange, for Nasdaq-listed stocks and for NYSE- and other-listed stocks that trade there, plus Nasdaq's opening, closing and halt auction imbalance data (NOII). "Level 2" is the general name for depth, and Nasdaq also sells a thinner product with that name. On Interactive Brokers, TotalView costs $16.50 a month for non-professionals. For scalping Nasdaq-listed small caps it is the first depth feed worth buying, but it shows one venue: in September 2026 the Nasdaq exchange executed about 20% of the share volume in Nasdaq-listed stocks, so pair it with NYSE ArcaBook and remember that about half of all volume trades off-exchange.
Nasdaq TotalView is the depth feed most day traders hear about first, usually from someone who says you cannot trade small caps without it. That is half true. TotalView is the deepest view of one important exchange. It is not a view of the whole market, and the name "Level 2" gets used for three different things, which makes the comparison confusing.
This post sorts out what TotalView shows, how it compares with "Level 2" in each sense, how much of the market it actually covers, and whether it is worth $16.50 a month to you. Prices and market share figures were checked on October 22, 2026.
What Nasdaq TotalView shows
In Nasdaq's own words, TotalView "displays the full order book depth on Nasdaq, including every single quote and order at every price level in Nasdaq-, NYSE-, NYSE American- and regional-listed securities trading on Nasdaq."
Three things in that sentence matter for a day trader:
- Every displayed order at every price. Not just the best bid and offer, but the whole stack behind them, as far as it goes.
- On Nasdaq. It is the book of one exchange, Nasdaq's main market. Orders resting on NYSE Arca, Cboe's exchanges, IEX or MEMX are not in it.
- For stocks listed elsewhere too. A stock listed on NYSE American still trades on Nasdaq, and TotalView shows that part of its book.
TotalView also carries Nasdaq's Net Order Imbalance Indicator (NOII) for the Nasdaq Opening and Closing Crosses and the Nasdaq IPO/Halt Cross. More on that below.
Nasdaq markets TotalView with two numbers of its own: "more than 20x the liquidity of Level 2," and "3X the liquidity within 0.05% of top-of-book as compared to alternative products, such as Level 2." Those are the vendor's claims about its own product, but they make the point: the extra depth is real, most of it is away from the inside, and the part near the inside is what a scalper uses.
Nasdaq TotalView vs Level 2: three meanings
"TotalView vs Level 2" is confusing because "Level 2" means different things depending on who says it.
| When someone says "Level 2" | What they mean | How it compares with TotalView |
|---|---|---|
| Any market depth | The order book behind the best bid and ask, as opposed to Level 1 | TotalView is one kind of Level 2 data |
| Nasdaq's product called Level 2 | An older, cheaper Nasdaq depth product | Nasdaq says TotalView carries more than 20 times its liquidity |
| The depth window on IBKR | IBKR's aggregated depth, merging every depth feed you subscribe to into one ladder | TotalView supplies the rows labeled NSDQ; other feeds add other venues |
For an IBKR trader, the third meaning is the one that matters. In TWS or any API platform, you subscribe to individual exchange books, and the depth window shows the venues you pay for. With TotalView alone, your Level 2 shows Nasdaq's book and nothing else. Add NYSE ArcaBook and rows marked ARCA appear. Our post on market maker IDs on Level 2 explains every venue code you will see.
How much of the market does TotalView see?
This is the question most "is TotalView worth it" answers skip. Cboe publishes monthly share volume for every US venue in its historical market volume data. For Nasdaq-listed stocks (Tape C) in September 2026:
| Where Nasdaq-listed shares traded, September 2026 | Share of volume |
|---|---|
| Nasdaq exchange (the TotalView book) | 20.10% |
| NYSE Arca (the ArcaBook book) | 10.60% |
| All other exchanges (Cboe EDGX, BZX and others, IEX, MEMX, NYSE and more) | 17.29% |
| Off-exchange (FINRA trade reporting facilities) | 52.01% |
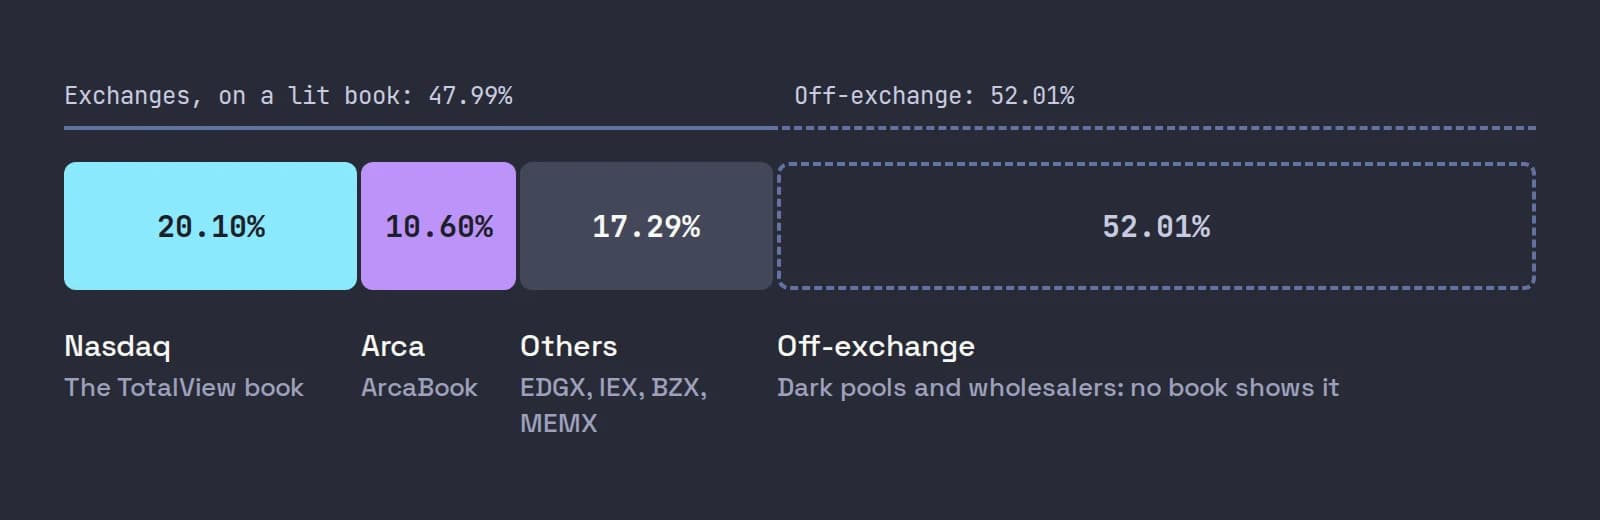
Across all US stocks that month, the Nasdaq exchange executed 14.01% of share volume. Two conclusions follow:
- Nasdaq is the biggest single lit book for Nasdaq-listed stocks. Its share is nearly double Arca's, which is why TotalView is the usual first depth feed.
- Even the biggest book shows a minority of the trading. More than half of the volume printed off-exchange, where no depth feed shows anything before the trade. Our post on hidden orders and dark pools covers that half.
Cboe's monthly data does not split out the pre-market, so we cannot give you a number for the session small-cap traders care about most. Treat the September figures as the whole-day picture.
NOII: the auction data inside TotalView
Nasdaq opens and closes each day with an auction, the Opening Cross and the Closing Cross. Before each one, it publishes the Net Order Imbalance Indicator: in Nasdaq's words, "constant updates to the share imbalance, indicative clearing prices and sentiment" for the coming auction. Per Nasdaq's crossing page, it disseminates opening imbalance information between 09:25 and 09:30 ET and closing imbalance information between 15:50 and 16:00 ET, and the data is available by subscription, including through TotalView.
For small-cap momentum traders, the opening imbalance can show whether a gapper has buyers or sellers waiting for the open. Nasdaq also lists NOII for its IPO/Halt Cross, the auction that reopens a halted Nasdaq-listed stock, which matters on stocks that hit LULD halts.
One caution: buying the feed does not guarantee your platform displays the NOII. IBKR's pricing page lists separate imbalance products for NYSE, NYSE Arca and NYSE American at $1.00 a month each, but we could not find IBKR documentation saying where TWS shows Nasdaq's NOII. Check in your own platform before you count on it.
Nasdaq TotalView on IBKR: what it costs
On IBKR, TotalView is sold as NASDAQ TotalView-OpenView. Prices from IBKR's market data pricing page, checked on October 22, 2026:
| Depth feed | Non-professional per month | Professional per month |
|---|---|---|
| NASDAQ TotalView-OpenView | $16.50 | $90.00 |
| NYSE ArcaBook | $11.00 | $65.00 |
| Cboe BZX | $8.00 | $47.00 |
| NASDAQ BX TotalView | $3.50 | $48.00 |
| NYSE OpenBook | $25.00 | $64.50 |
Every depth feed sits on top of live level 1 quotes, which cost extra. You can also only stream a limited number of books at once: one depth symbol per 100 market data lines, with a minimum of 3. For the full subscription steps, the level 1 bundles and the depth limit, see our post on IBKR Level 2 and the post on IBKR market data lines.
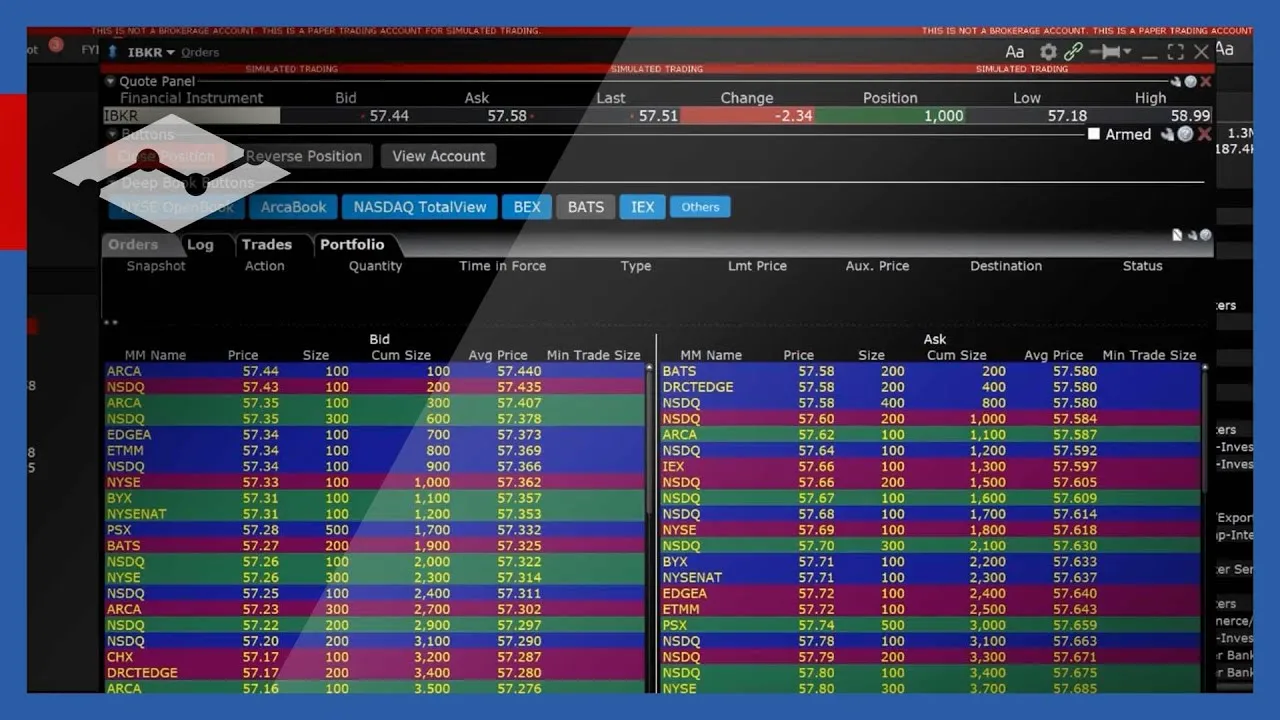
IBKR's own lesson on Market Depth Trader shows how depth from each exchange appears in TWS and how to switch exchanges' books on and off, which is the quickest way to see what TotalView adds to your screen:
Is TotalView worth it?
Our verdict, by trader:
| You trade | TotalView? | Why |
|---|---|---|
| Nasdaq-listed small caps, scalping | Yes, first | The largest lit book for those stocks: about 20% of their volume in September 2026 |
| Nasdaq-listed small caps, plus a second feed | TotalView and ArcaBook | Together about 31% of September's Tape C volume, the two largest lit books |
| Mostly NYSE-listed stocks | Probably not first | NYSE OpenBook and ArcaBook cover the books that matter more for those names |
| Swing trades, entries over minutes or hours | No | Depth changes in milliseconds; it will not change a multi-day decision |
| Not sure you will keep day trading | Not yet | Practice reading the book on a paper account first |
The cost math is easy. At $16.50 a month, TotalView pays for itself if it saves you one cent on 1,650 shares in that month. For an active scalper that is a low bar. What it will not do is tell you which way a stock goes next. Depth shows who is willing to trade where right now, and much of it can be cancelled before you reach it. Our how to read Level 2 pillar covers what the book can and cannot tell you.
Where Scalpel fits
Scalpel is a desktop day-trading cockpit for your own Interactive Brokers account. It does not sell data. It draws its Level 2 montage from IBKR's SMART depth, which merges the depth feeds you subscribe to into one ladder, so with TotalView you get rows labeled NSDQ, and each feed you add fills in more venues. The market data guide lists what each part of a desk needs.
Colouring the montage By venue gives every exchange its own fixed colour, which makes it easy to see how much of the book is Nasdaq's and how much comes from Arca and the rest.
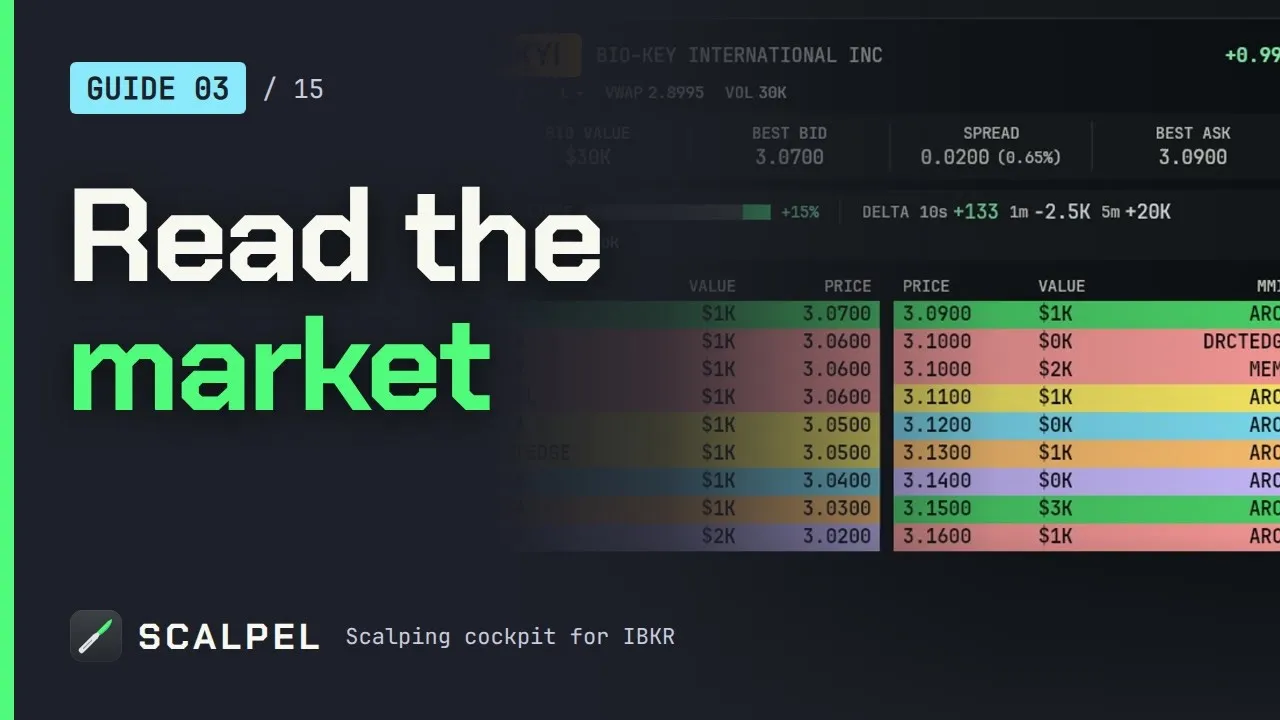
Scalpel does not display Nasdaq's NOII. Its IMBALANCE gauge is something different: the balance of displayed size on the bid and ask near the inside of the book, across all the venues you subscribe to (read Level 2). The iceberg orders guide and read the players cover the footprints worth watching on any feed. Our section video shows the montage in use:
Scalpel needs the same IBKR depth subscriptions and the same limit on books at once as TWS. It is long only, and its stops are watched by the app rather than resting at IBKR, so they only work while Scalpel runs with a live feed.
Scalpel is independent and not affiliated with or endorsed by Nasdaq or Interactive Brokers.
Trading carries a significant risk of loss. Nothing here is financial advice.
Questions
- What is Nasdaq TotalView?
- Nasdaq's full depth-of-book feed. It shows every displayed quote and order at every price on the Nasdaq exchange, for Nasdaq-listed stocks and for other-listed stocks that trade there, plus Nasdaq's Net Order Imbalance Indicator for its opening, closing and halt crosses.
- What is the difference between TotalView and Level 2?
- Level 2 is the general name for market depth, and also the name of an older, thinner Nasdaq product. TotalView is Nasdaq's full book, which Nasdaq says carries more than 20 times the liquidity of its Level 2 product.
- How much is Nasdaq TotalView on Interactive Brokers?
- On October 22, 2026, NASDAQ TotalView-OpenView cost $16.50 a month for non-professional subscribers and $90.00 for professionals on IBKR, on top of live level 1 data. Check IBKR's market data pricing page for current prices.
- Is Nasdaq TotalView worth it for day trading?
- For scalping Nasdaq-listed small caps, usually yes: it is the largest lit book for those stocks. It shows one exchange, though, so many traders add NYSE ArcaBook, and more than half of all volume trades off-exchange where no depth feed shows it.
- Does TotalView show the whole market?
- No. In September 2026 the Nasdaq exchange executed about 20% of share volume in Nasdaq-listed stocks. Other exchanges and off-exchange venues handled the rest.
- What is NOII in TotalView?
- The Net Order Imbalance Indicator: the share imbalance and indicative clearing prices for Nasdaq's auctions. Nasdaq publishes it from 09:25 to 09:30 ET before the open and 15:50 to 16:00 ET before the close.
Related guides
Guide 1.6The IBKR market data you need for Level 2The IBKR market data that gives Scalpel live quotes, Level 2 and the tape, with no third-party feed to pay for, and how delayed or missing data shows.Guide 3.1How to read Level 2 in ScalpelRead Scalpel's DAS-style Level 2: bids left, asks right, optional colour bands per price, venues, spread, imbalance and delta, and reading players by behaviour.Guide 3.2Spot iceberg orders on Level 2How Scalpel flags an iceberg: one venue refilling a small size while far more trades there, the exact rule behind the icon, and why it is not a floor.
Keep reading
- How to read Level 2: a plain guide for day tradersHow to read Level 2 step by step: the spread, stacking and thinning, reading the book against the tape, what depth hides, and why pre-market books mislead.
- IBKR Level 2: which subscription, what it costs and how to read itIBKR Level 2 explained: which depth feeds to buy and what they cost today, the TWS limit on books at once, and how to read the book, pre-market included.
- Level 1 vs Level 2 market data: what the difference means for a tradeLevel 1 vs Level 2 market data: top of book vs depth, a worked example of what your size really costs, IBKR prices, and who actually needs Level 2.
Practice in SIM, against the live book.A lifetime license, every update included, with a 7-day refund guarantee.Ask in DiscordGet Scalpel