Tape reading for scalpers: speed, size and what the prints say
By Scalpel Team. , updated . 8 min read.
In short
Tape reading is judging who is in control of a stock from the flow of trades on time and sales. Watch four things: speed (prints arriving much faster than the stock's normal pace), size (prints far bigger than usual), side (buyers lifting the ask or sellers hitting the bid) and price response (whether price moves when size trades). Heavy buying at one price that does not lift it is absorption: a seller is there. For a scalper the tape helps time an entry at a breakout and spot when buying dries up. It is a short-term read, minutes at most, and an imperfect one.
Traders read paper ticker tapes long before screens existed. Stock tickers date to 1867, and Thomas Edison's 1869 ticker printed about one character a second (Wikipedia: ticker tape). The tape now moves thousands of times faster, but the idea has not changed: prices and sizes in sequence tell you who is in a hurry.
This post is about reading that flow in real time: speed, size, absorption and the breakout. If you are new to the window itself, its columns, colors and condition codes, start with how to read time and sales. Facts here were checked on October 22, 2026. Scalpel is independent and not affiliated with or endorsed by Interactive Brokers.
What tape reading is, and what it is not
Reading time and sales is knowing what a print means. Tape reading is reading the sequence: the rhythm, the clusters, the change. A single print tells you almost nothing. Fifty prints in two seconds, nearly all at the ask, with the price stepping up a cent at a time, tell you a lot.
We use the tape to answer three questions on a long:
- Is anyone actually buying? The book can show a stacked bid that is never hit. The tape shows trades.
- Is the level I want to buy through being absorbed? Size trading at one price without moving it.
- Is the move tiring? Speed and size fading, or sellers starting to hit bids at the high.
It is not a way to predict where a stock will be in an hour. The research section below explains why.
Tape speed: how fast is fast
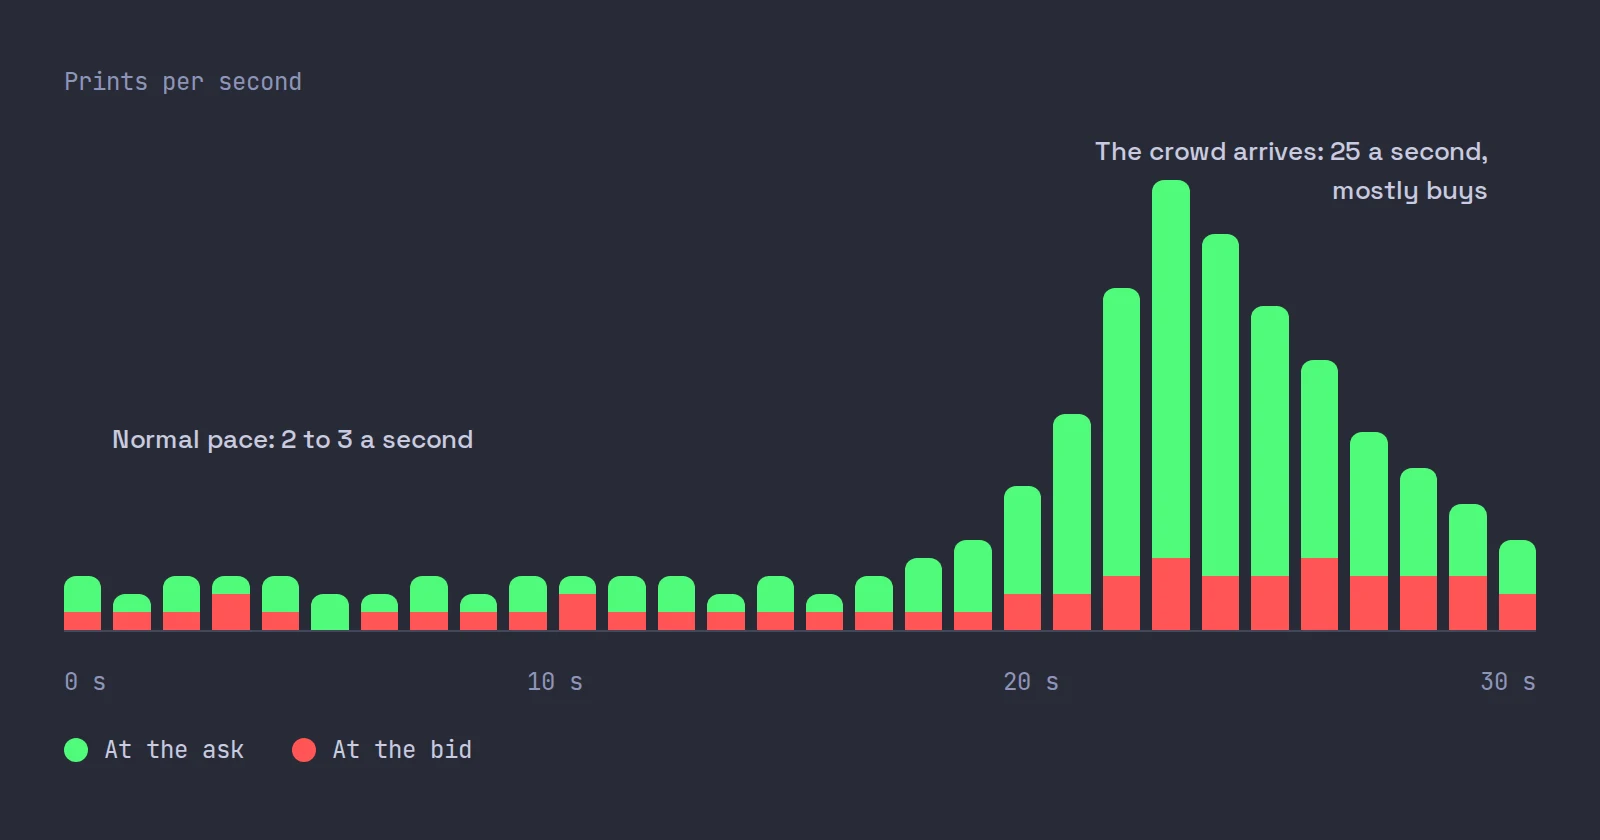
Tape speed is how many prints arrive per second, and it only means something against the stock's own baseline. A stock that has printed two or three trades a second all morning and suddenly prints 25 in a second has a crowd arriving. A stock that always prints 25 a second has not changed.
So the first skill is knowing the normal pace for this stock today. Watch it for a minute before you trade it. Then look for the change:
- Acceleration with green prints at the ask: buyers arriving. This is what you want to see as price approaches a breakout level.
- Acceleration with red prints at the bid: sellers arriving. Under a long, that is the time to check your exit.
- Acceleration with no price progress: both sides are trading heavily and nobody is winning. Often a top or a fight at a level.
- Deceleration after a run: the buyers who were paying up have stopped. A move that slows on the tape tends to stall on the chart soon after.
One caution if you trade in TWS: IBKR notes that in an active market its Time & Sales window can show a "+" in front of a tick, meaning "aggregated ticks over a certain timeframe" (IBKR Guides: Time & Sales). When the tape is fastest, the window may be summarizing it. Watch volume and price progress too, not only the row count.
Size: what counts as a big print
Size is also relative. On a $4 small cap, 10,000 shares is $40,000. On a $40 stock the same number of shares is $400,000. Thinking in dollars makes size comparable across stocks, which is why some platforms, Scalpel included, can show each print's dollar value instead of its share count.
What matters is size against two things:
- The stock's usual print. If most prints are 100 to 500 shares, a run of 5,000-share prints is a different participant.
- The size shown on the book. A 5,000-share print at a price where the book showed 300 shares means there was far more stock there than was displayed.
Big prints that move price a cent and stop are often one order sweeping the offers. Big prints that do not move price at all are the interesting ones.
Absorption: size that does not move price
Absorption is the most useful tape read we know, and the easiest to describe with numbers.
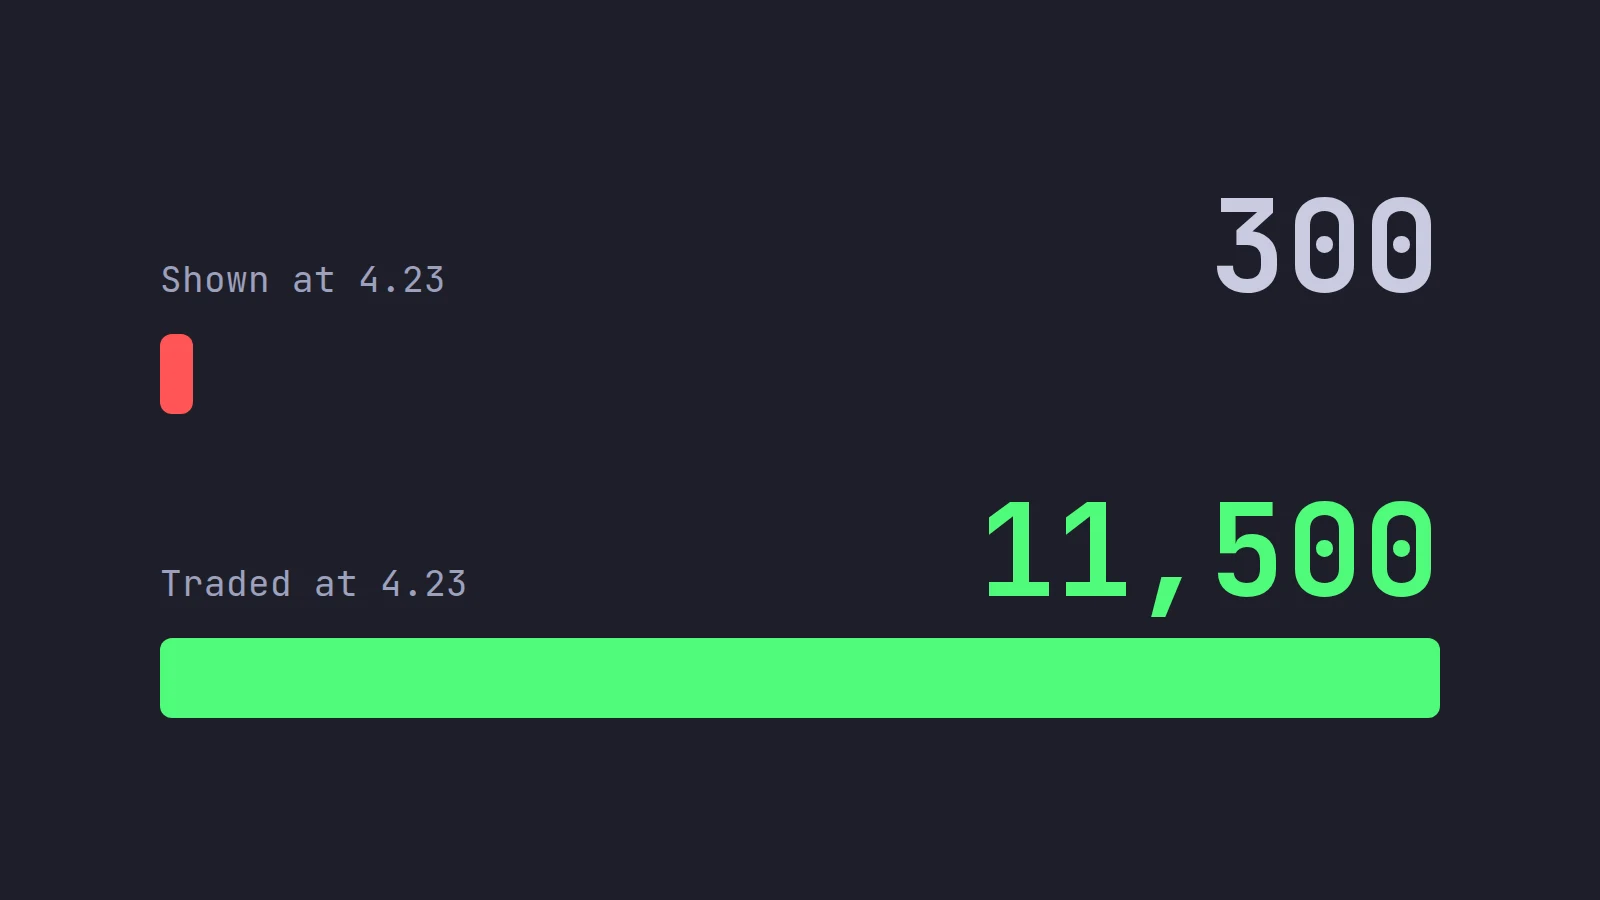
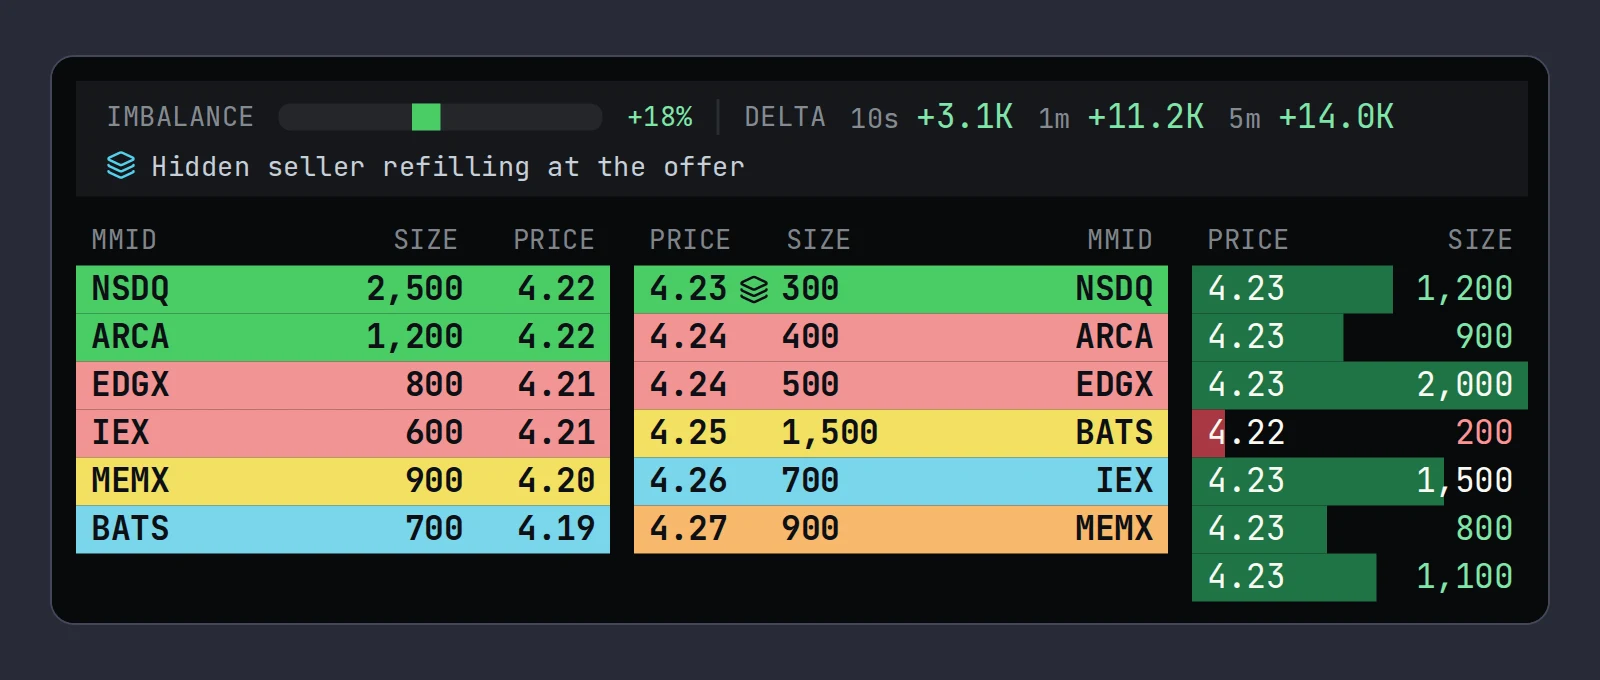
ABCD is 4.22 bid, 4.23 ask. Nasdaq shows 300 shares offered at 4.23. Over the next 40 seconds the tape prints 11,500 shares at 4.23, nearly all green, and the ask never moves. The book still shows 300 at 4.23.
That is roughly 38 times the displayed size traded at one price without lifting it. Someone is selling far more than they show and refilling the offer: a reserve or iceberg order. Buyers are paying up, the seller is matching every share, and price cannot rise until that seller is finished.
There are two endings, and the tape tells you which one you are in:
| What happens next | What it means | What we do on a long |
|---|---|---|
| A print at 4.24, then more at 4.24 and 4.25 | The seller is done or gone. The supply at 4.23 was absorbed | This is the entry many momentum traders wait for: the offer is open |
| Green prints slow, red prints appear at 4.22 | Buyers gave up before the seller did | Do not buy into it. If already long from below, tighten up |
The mirror image works on the bid: heavy red prints at 4.22 that do not push the bid lower mean a buyer is absorbing selling. That is not a floor. When the buyer's order is filled, nothing is left at that price, so place your stop where your trade is wrong, not just under the absorbing bid. Our iceberg orders guide gives the exact rule Scalpel uses to flag a refilling venue.
Reading a breakout on the tape
Here is the sequence we look for on a high of day breakout in a momentum stock, reading the tape against the book:
- Before the level: the tape quickens as price approaches the high. Green prints outnumber red.
- At the level: the offers at the high get hit repeatedly. Watch for absorption: if a seller is refilling there, wait.
- Through the level: prints above the old high, at the ask, in size. The offers above thin out on Level 2 as they are taken.
- Follow-through: prints keep coming at higher prices without long pauses, and the bids step up behind the price.
And the warning signs that a breakout is failing:
- The tape is fastest at the exact high, then slows sharply while price sits there.
- Big red prints appear at or just under the high: sellers using the buying to get out.
- Prints above the level are small and few, then the next prints are back below it.
None of these is a signal on its own. They are reasons to act faster when the chart and the book already agree, or to stand aside when they do not. How to read Level 2 covers the book side of this read.
What the research says about the limits
Tape reading has real limits, and we would rather you hear them from us than learn them with your account.
- Volume alone is noisy. Studying NYSE data for 50 US stocks, Cont, Kukanov and Stoikov (2014, Journal of Financial Econometrics) found short-term price changes are mainly driven by order flow imbalance at the best bid and ask, while the link between price changes and raw trade volume was noisy and less reliable. Big prints alone are a weak signal. Prints combined with what they do to the inside are a better one.
- The edge is short. Chordia, Roll and Subrahmanyam (2005, Journal of Financial Economics) found that on the NYSE it takes more than five minutes but less than sixty for the market to remove the return predictability that order imbalances leave. Whatever the tape tells you, it tells you for minutes.
- The colors are guesses. Using Nasdaq data with known trade direction, Ellis, Michaely and O'Hara (2000, Journal of Financial and Quantitative Analysis) found the best standard rule classified 81.05% of trades correctly, and all rules struggled with trades inside the quotes.
- Much of the volume is invisible until it prints. In the SEC's figures for the first quarter of 2022, about 40% of US stock share volume was executed off-exchange (SEC Release 34-96495). Those trades reach the tape after the fact, often between the bid and ask, with no order on the book beforehand. Hidden orders and dark pools covers them.
- The tape can be painted. Trades placed to create an impression of activity are manipulation and illegal, but they still print. Spoofing on Level 2 covers the book-side version.
The honest summary: tape reading improves your timing and your exits. It does not turn a bad setup into a good one.
How to practice tape reading
Tape reading is a pattern skill, and patterns take hours of screen time. Some ways to build it without paying for every lesson:
- Watch one stock at a time. Pick the most active small cap of the morning and only watch its tape and book for 30 minutes. Say out loud what you think is happening, then check the chart five minutes later.
- Write down absorption events. Price, displayed size, traded size, and what happened next. After 50 of them you will have your own numbers, which are worth more than any rule of thumb.
- Trade it on paper first. A simulator that fills against the live book teaches you what the tape feels like when you are in a trade, without the cost.
Where Scalpel fits
Scalpel puts the tape in a column beside the Level 2 book on each desk and does some of the adding up for you. DELTA above the book is shares bought at the ask minus shares sold at the bid over 10 seconds, 1 minute and 5 minutes, so you see the balance of the flow without counting rows. When a venue keeps refilling the same price while at least three times its displayed size trades there, the montage marks it with a layers icon and the read line says Hidden seller refilling at the offer. The time and sales guide covers the tape column, and reading the players shows absorption, vanishing size and bids stepping up as they look on the montage.
The feature we use most for tape reading is sound. With tape sound on, buys play bright notes in your right ear and sells lower notes in your left, and bigger trades play longer figures, so you hear the tape speed up and change side while your eyes stay on the book. The idea, inspired by Aggr.trade, is explained in tape reading by ear. Scalpel is independent and not affiliated with Aggr.trade.
Our short video shows the tape, the delta and the read line in action.
Practice in Scalpel's SIM mode, which fills against the live book with IBKR commissions (paper trading in SIM), before you trade a tape read with real money.
Trading carries a significant risk of loss. Nothing here is financial advice.
Questions
- What is tape reading in trading?
- Reading the sequence of trades on time and sales to judge who is in control: how fast prints arrive, how big they are, whether buyers are lifting the ask or sellers hitting the bid, and whether price moves when size trades.
- How do you read the tape for day trading?
- Learn the stock's normal pace first, then watch for changes: acceleration with prints at the ask, unusually large prints, and heavy trading at one price that does not move it. Read the tape against the Level 2 book and the chart, not on its own.
- What is absorption on the tape?
- Heavy buying or selling at one price that does not move it, because a large order on the other side keeps filling. Thousands of shares printing at an ask that shows a few hundred means a hidden seller is absorbing the buying.
- What does tape speed mean?
- How many trades print per second compared with the stock's own normal pace. A sudden acceleration means new participants have arrived; the color of the prints tells you which side.
- Does tape reading still work with algorithms and dark pools?
- Partly. The tape still shows every reported trade, but about 40% of US share volume trades off-exchange and reaches the tape after the fact, and the edge in order flow fades within minutes. Use it for timing and exits, not forecasts.
Related guides
Guide 3.3Read the time and sales tapeRead the time and sales tape in Scalpel: prints coloured by who took liquidity, size bars, dollar values, the size filter, and the tape against Level 2.Guide 3.4Hear the tape: tape soundHear the tape, inspired by Aggr.trade: buys in the right ear, sells in the left, block trades by their shape. Set the big print value, gate and volume.Guide 3.7Read the players on Level 2: venues, refills and sizeRead who is doing what on Scalpel's DAS-style montage: venues refilling a price, big size that holds or vanishes, bids stepping up, and the honest limits.
Keep reading
- How to read Level 2: a plain guide for day tradersHow to read Level 2 step by step: the spread, stacking and thinning, reading the book against the tape, what depth hides, and why pre-market books mislead.
- IBKR Level 2: which subscription, what it costs and how to read itIBKR Level 2 explained: which depth feeds to buy and what they cost today, the TWS limit on books at once, and how to read the book, pre-market included.
- Level 1 vs Level 2 market data: what the difference means for a tradeLevel 1 vs Level 2 market data: top of book vs depth, a worked example of what your size really costs, IBKR prices, and who actually needs Level 2.
Practice in SIM, against the live book.A lifetime license, every update included, with a 7-day refund guarantee.Ask in DiscordGet Scalpel