The best chart setup for day trading: timeframes and indicators
By Scalpel Team. , updated . 15 min read.
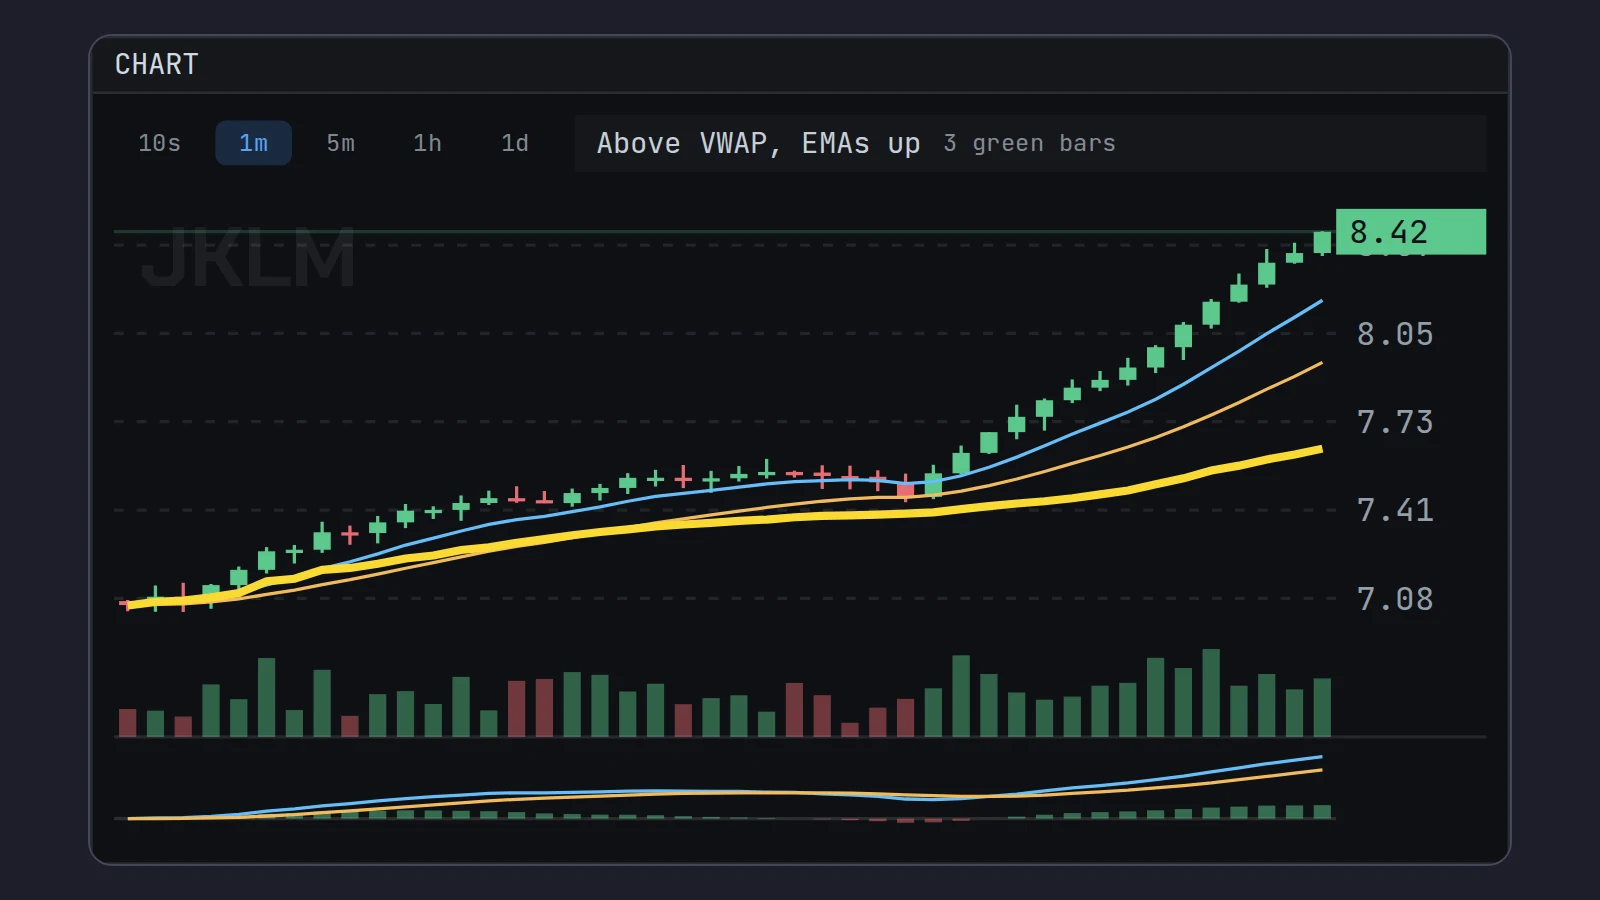
In short
The best chart setup for day trading is a small one: candlesticks on a 1-minute chart for timing, a 5-minute chart for context (a 10-second chart if you scalp), volume under the candles, VWAP, the 9 and 20 EMAs, and a few horizontal levels such as the pre-market high, the high of day and the nearest whole and half dollars. MACD is optional, as a filter. Every one of these describes what price has already done; none of them predicts. The research on intraday indicator rules is mostly negative once data snooping is accounted for, so use the chart to place entries and stops, not to generate buy signals.
Ask ten day traders for their chart setup and you get ten screenshots, most of them crowded: three moving averages, Bollinger Bands, RSI, stochastics, a MACD and some lines nobody remembers drawing. The best chart setup for day trading is the one you can read in the second you have before a decision. That means few layers, each answering a different question.
This pillar covers the whole cluster: timeframes, candles, volume, VWAP, EMAs, MACD and levels, what the research says about each, and how to set it up in Trader Workstation (TWS). We build Scalpel, a day trading cockpit for Interactive Brokers, and its chart uses this exact set. Scalpel is independent and not affiliated with or endorsed by Interactive Brokers or TradingView.
The best chart setup for day trading, in one table
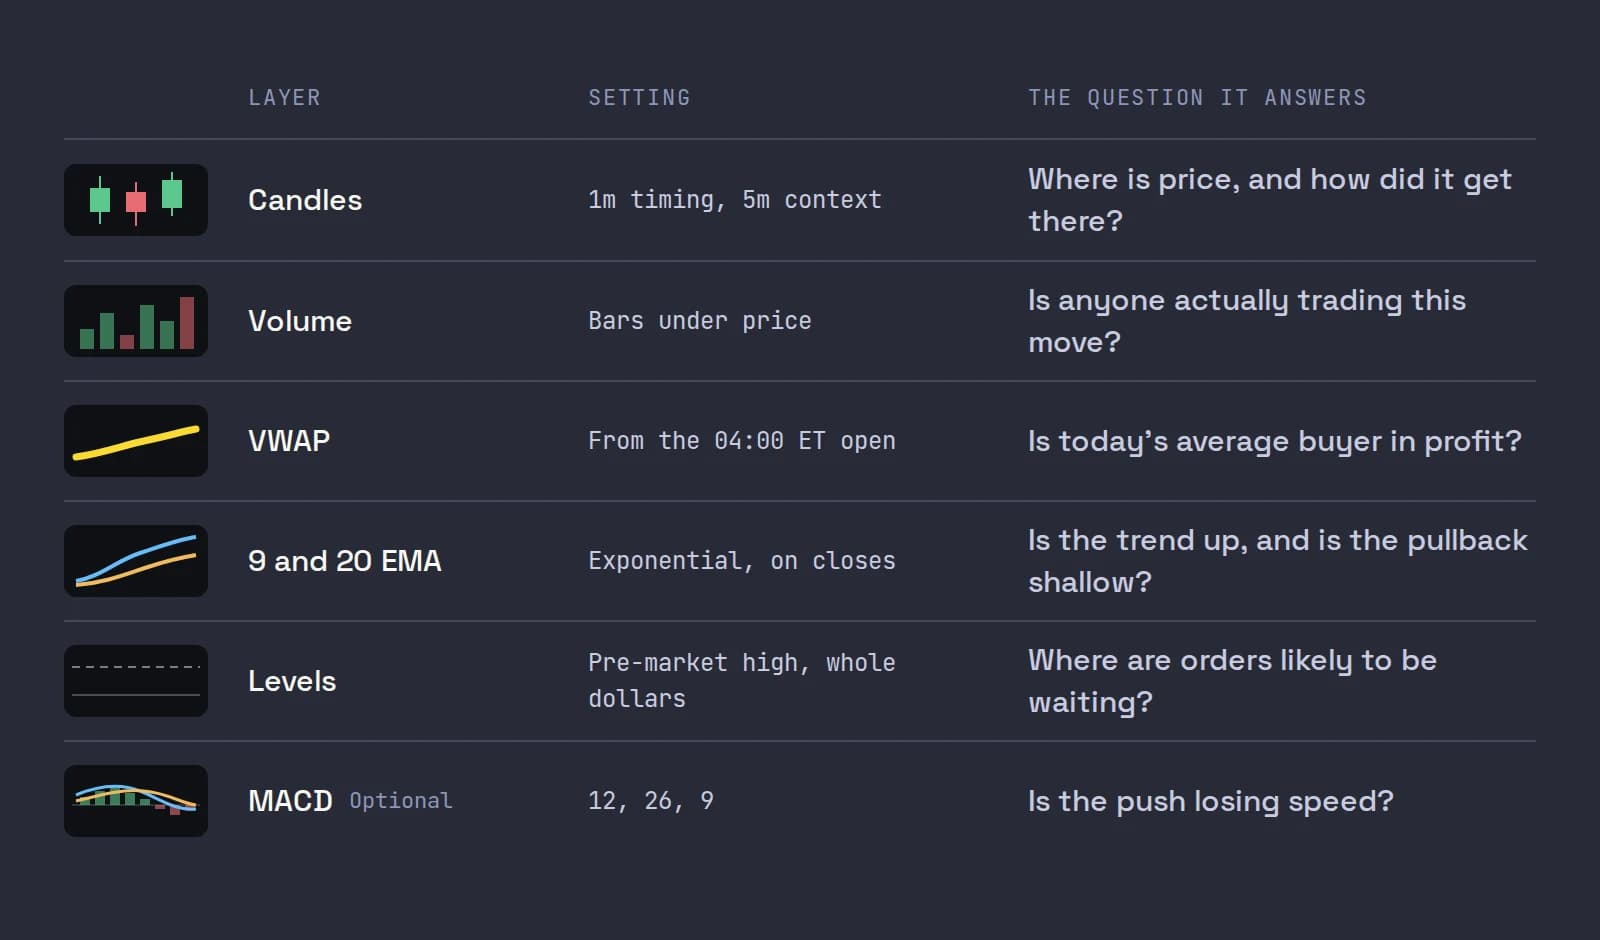
| Layer | Setting | The question it answers |
|---|---|---|
| Candles | 1-minute for timing, 5-minute for context, 10-second for scalp entries | Where is price, and how did it get there? |
| Volume | Bars under the candles | Is anyone actually trading this move? |
| VWAP | Session VWAP, ideally from the pre-market open | Is the average buyer today in profit or under water? |
| 9 and 20 EMA | Exponential, on closes | Is the short-term trend up, and is the pullback still shallow? |
| Levels | Pre-market high, high of day, whole and half dollars | Where are orders likely to be waiting? |
| MACD | 12, 26, 9, optional | Is the push losing speed? |
Six layers. In our own app, all but MACD are on by default, and the level lines it draws for you are the whole and half dollars. If something you add does not answer a new question, it is clutter. RSI and stochastics, for example, are built from the same closes as the EMAs and MACD, so they mostly repeat what you already see.
What the research says about chart indicators
Before the settings, the honest part. Technical analysis has been tested for decades, and the results are mixed at best, and worse the shorter the timeframe.
- The broad review. Park and Irwin surveyed the modern literature in the Journal of Economic Surveys (2007). Of 95 modern studies, 56 found positive results for technical trading rules, 20 negative and 19 mixed. The authors also warn that most of those studies suffer from data snooping, rules chosen after the fact, and hard-to-estimate risk and transaction costs.
- Intraday, specifically. Marshall, Cahan and Cahan tested 7,846 popular technical trading rules on intraday US equity data in the Journal of Empirical Finance (2008). None was profitable once data snooping was taken into account.
- Small caps. Shynkevich tested technical rules on small-cap and technology portfolios from 1995 to 2010 in the Journal of Banking and Finance (2012). Some rules showed predictive power in the first half of the sample; in the second half, none beat buy and hold for any portfolio.
- Patterns carry some information. Lo, Mamaysky and Wang, studying a large number of US stocks from 1962 to 1996, found that "several technical indicators do provide incremental information" (NBER working paper 7613, published in the Journal of Finance in 2000). Information is not the same thing as a profitable rule after costs, but it is a reason to read the chart rather than ignore it.
Then there is the trader. Barber, Lee, Liu and Odean followed day traders in Taiwan from 1992 to 2006 and concluded that less than 1% of the population could predictably and reliably earn positive abnormal returns net of fees (Journal of Financial Markets, 2014). Our post on day trading statistics goes through that research in full.
So our verdict, and the stance of this whole cluster: indicators describe, they do not predict. A chart is useful because it shows you where the trade is wrong (your stop) and where it is likely to stall (your target), which lets you size the position and decide whether the trade is worth taking. That is a lot. It is not an edge on its own.
Timeframes: 10-second, 1-minute, 5-minute and daily
A timeframe is just how much time each candle covers. Each one hides different noise and shows a different story.
| Timeframe | What it shows | Who uses it |
|---|---|---|
| 10-second | Every push and pause inside a minute; the exact bar a breakout started | Scalpers timing entries on fast small caps |
| 1-minute | The intraday trend, pullbacks, the high of day | Most momentum day traders, as the main chart |
| 5-minute | The structure of the morning: is this one move or a series of higher lows? | Context, and slower setups |
| Daily | Where the stock sits against its history: prior highs, gaps, old resistance | The pre-market check, not the trade |
Our view: run two. A fast chart to time the entry and a slower one to stop the fast chart from talking you into a trade against the bigger picture. The common pairing is 1-minute and 5-minute; scalpers on fast small caps swap in the 10-second for the 1-minute. Our post on the best timeframe for scalping compares 10-second, 1-minute and 5-minute charts in detail, including tick charts.
One practical limit if you trade through Interactive Brokers: IBKR does not serve bars of 30 seconds or less that are older than six months, on any of its platforms. You cannot backtest your 10-second reads over years of IBKR data; 1-minute bars and longer go back much further.
Candlesticks: what one bar tells you
Each candle shows four prices: the open, high, low and close of its period. The body runs from open to close (green if it closed up, red if down), and the wicks show how far price traveled and was rejected. That is the whole content of a candle. A long upper wick means price went up there and sellers pushed it back; it does not mean price will now fall.
A handful of shapes are worth naming on an intraday chart, because they describe a fight you care about: the doji (open and close at nearly the same price), the hammer and the shooting star (a long wick on one side), and the engulfing bar. Our post on candlestick patterns for day trading covers those and why context, meaning where the candle forms, matters more than the shape. A shooting star at the pre-market high, on volume, is information. The same shape in the middle of a quiet range is noise.
Volume: the layer that says whether a move matters
Volume bars under the candles answer the question price cannot: how many shares changed hands to make that move. A breakout on rising volume has buyers behind it. A breakout on the thinnest bar of the morning may be one order in an empty book.
Price tells you where. Volume tells you how many people agreed to trade there, which is the closest thing a chart has to a measure of conviction.
Two volume reads earn their place:
- Volume against the stock's normal. A stock trading 10 times its usual volume is in play; one trading its usual amount is not. That is relative volume, and it belongs on your scanner more than on your chart.
- Volume on the pullback. In a healthy move, the red bars of a pullback are lighter than the green bars of the push. Heavy red volume on the pullback means sellers are not just taking profit.
VWAP: the day's average price
VWAP, the volume-weighted average price, is the average price paid for every share traded today: the sum of price times volume, divided by total volume. It started as an execution benchmark for institutions, and brokers, IBKR included, still offer algorithms that aim to fill large orders at it.
For a day trader, VWAP answers one question: is the average buyer today in profit? Above VWAP, the people who bought today are mostly green and have little reason to sell. Below it, many are holding a loss and will sell into strength to get out. That is why a reclaim of VWAP, or a close back under it, is a moment traders watch.
Two settings matter more than people think:
- The anchor. Many platforms start VWAP at the 09:30 ET open. For a stock that gapped and traded millions of shares in the pre-market, a VWAP that starts at 04:00 ET, when Nasdaq's pre-market session opens, counts the buyers who built the gap. The two lines can be far apart at 09:31.
- The same line on every timeframe. VWAP should be computed from a session-long series and drawn on whatever timeframe you view, so the 10-second and 5-minute charts agree.
The full formula, a worked computation bar by bar, and how traders use reclaims and losses are in our post on VWAP for day trading.
The 9 and 20 EMA: trend at a glance
An exponential moving average (EMA) is an average of recent closes that weights the newest bar most. Each new bar moves it by a fixed fraction of the gap between the close and the old EMA: 2 divided by (period + 1). For the 9 EMA that fraction is 0.2, so the latest close carries 20% of the weight; for the 20 EMA it is 2/21, about 9.5%.
On a 1-minute chart of a momentum stock, the 9 EMA hugs price in a strong push and the 20 sits underneath. Price riding above a rising 9, with the 9 above the 20, describes a strong short-term trend. A pullback that holds the 9 is shallow; one that loses the 20 is deeper, and often the end of the move's first leg.
EMAs are lagging by construction. On a 1-minute chart, the 9 EMA's weights center about 4 bars back, the 20's about 9.5 bars back. So a cross of the 9 below the 20 usually comes after the top, not at it. Our post on the 9 and 20 EMA for day trading works through the formula with numbers, and covers what the long-run research on moving average rules actually found.
MACD: a filter, not a trigger
MACD (moving average convergence divergence), created by Gerald Appel in the late 1970s, is the 12-period EMA minus the 26-period EMA. A 9-period EMA of that difference is the signal line, and the histogram is the gap between the two. IBKR's own guide to short-term chart indicators in TWS gives the same formulas.
Because MACD is built from EMAs of EMAs, it lags more than the EMAs themselves. On a 1-minute chart of a small cap that runs 15% in four minutes, the MACD crossover often arrives after the move is done. That is why we treat it as a filter: a long setup with MACD below its signal line and falling is a long against slowing momentum, so you might pass, or take half size. It is a reason to skip, not a reason to buy.
Our post on MACD for day trading covers settings (including why 12, 26, 9 survives on 1-minute charts), the histogram, crossovers and divergence.
Levels: pre-market high, high of day, whole and half dollars
Horizontal levels are where orders are likely to be waiting. They are the cheapest and most useful thing you can draw on a chart. The four that matter most on a momentum small cap:
- The pre-market high. The top of the pre-market range. The first push through it after 09:30 is one of the most watched moments of the day.
- The high of day. Once the open is behind you, the current day's high is where breakout buyers and trapped sellers meet.
- Yesterday's close and the gap. For a gapper, a fade back toward the prior close is the risk.
- Whole and half dollars. Round numbers attract orders.
The round number effect is one of the better-documented things in market microstructure. Bhattacharya, Holden and Jacobsen studied more than 100 million US stock transactions and found excess buying one cent below round numbers and excess selling one cent above, with the effect largest at whole dollars, next at half dollars, and so on down (Management Science, 2012). They estimated that this behavior costs the traders doing it losses approaching $1 billion a year. For a trader, that means a stock at $4.92 may meet sellers stacked at $5.00, and a stop at exactly $4.50 sits where everyone else's does. Our post on whole and half dollar levels goes through the evidence and what it means for entries, targets and stops.
Patterns: flags and pullbacks
Patterns are levels plus a shape. The one that matters most on a momentum chart is the bull flag: a sharp move up (the pole), a tight, orderly pullback on lighter volume (the flag), then a break of the flag's high. The flag gives you everything a trade needs: an entry (the break), a stop (under the flag's low) and a reason (buyers did not let the pullback go deep). Our post on the bull flag pattern shows how to trade it in small caps, where it fails, and what the published statistics on flags do and do not show.
The same logic runs through the first pullback setup: wait for the first dip after a fresh high, buy the first candle that makes a new high, stop under the dip.
Reading one chart: a worked example
Here is how the layers combine into a decision. A fictional stock, ABCD, gapped up on news and is trading at $4.62 at 09:41 ET on a 1-minute chart.
| Layer | What it reads |
|---|---|
| VWAP (from 04:00) | $4.41: price is 21 cents above, so today's buyers are in profit |
| 9 and 20 EMA | $4.55 and $4.47: 9 above 20, both rising |
| Levels | Pre-market high $4.80, then the $5.00 whole dollar |
| Volume | The last pullback came on lighter bars than the push |
| Pullback low | $4.64 on the last red candle |
The plan: buy a break of the pre-market high at $4.81, stop under the pullback low at $4.63, so 18 cents of risk per share. With $50 of risk, that is 50 / 0.18 = 277 shares, call it 275. The first target is just under the whole dollar, at $4.98: 17 cents of reward, less than one times the risk.
That last line is the point of reading the chart. The setup looks clean, and yet the nearest obvious resistance sits only 17 cents away against 18 cents of risk. Many traders would pass, or wait for a break of $5.00 instead. No indicator told you to buy; the chart told you what the trade is worth. Sizing from a stop like this is covered in our guide to trading a fixed dollar risk.
Day trading chart settings in TWS
You can build this whole setup in Trader Workstation, with no extra subscription beyond IBKR market data. TWS has two charts, its standard chart and an advanced chart powered by TradingView; most studies exist in both. These steps are for the standard chart.
Open a chart
From New Window, under General Tools, choose Charts (IBKR toolbox). In Mosaic, put the chart in the same color link group as your watchlist so one click loads the stock everywhere.
Set the bar size and show extended hours
Use the time period drop-down at the top left to pick 1-minute candles. Open Edit > Chart Parameters, and in the chart time options at the bottom tick the option to show data outside regular trading hours, so the pre-market high is on the chart.
Add VWAP and volume
On the Chart Parameters tab, add VWAP from the Additional Data section and make sure Volume is ticked. Click Apply to keep the window open while you check the result.
Add the 9 and 20 EMA
On the Studies tab, expand Moving Averages, choose the exponential moving average, click Add, and set the period to 9. Repeat with 20. Give them distinct colors.
Optional: add MACD
Under Momentum Studies, add MACD. IBKR documents it as the difference of 12 and 26-period averages with a 9-period EMA signal line; set the averages to exponential if the study offers a choice.
Open a second chart for context
Open another chart on the same symbol with 5-minute candles, or 10-second ones if you scalp.
IBKR's own lesson walks through these menus on screen, including the bar size drop-down, the Chart Parameters panel and the Studies tab:
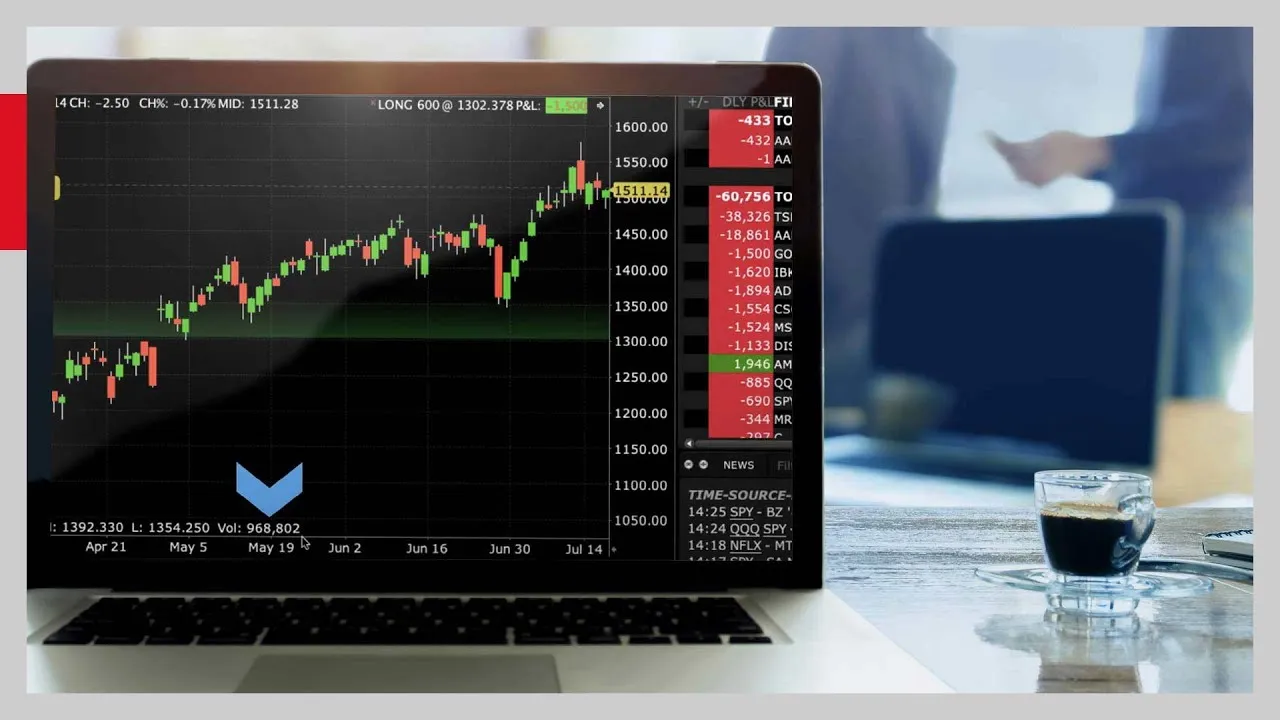
Check which session your platform's VWAP starts from: look at the line at 09:31 on a stock that traded heavily before the open. If it starts fresh at the open, it ignores the pre-market buyers. The menu names are from IBKR's own lessons, checked on October 22, 2026; IBKR renames things between TWS versions.
What to leave off
- More moving averages. The 50 and 200 period lines matter on a daily chart. On a 1-minute chart they are a 50-minute and 200-minute average, a long way behind a stock moving 1% a minute.
- Several oscillators. RSI, stochastics and MACD are all transformations of the same closes. Pick one at most.
- Lines you cannot explain. If you cannot say in one sentence what a line means for the trade, take it off.
- Smoothed candles. Heikin-Ashi and Renko hide the real open, high, low and close, which is what your stop and fills are measured against.
Where Scalpel fits
Scalpel's chart is this setup out of the box, on every desk: candles from 10 seconds to daily, volume, a session VWAP anchored at 04:00 ET so pre-market volume counts, the 9 and 20 EMAs, and faint lines at whole and half dollars. MACD and a buy-minus-sell delta pane are one click away in the chart's cog, off by default so the candles get the room. The data is IBKR's own history and live bars, the same feed as your book and tape, so there is no TradingView subscription and no separate chart data bill.
Above the chart, the read bar states the facts in words, such as Above VWAP, EMAs up, and raises only two warnings, Bull trap and Lost VWAP, the two reads that held up when we replayed them over recorded sessions. Everything else we tried was removed because it did no better than a coin flip; the details are in read line and read bar. Your stop and target sit on the chart as lines you drag (drag stops and targets), and every layer is listed in chart basics and the panel settings guide.
Our two-minute section video shows the chart, the Level 2 and the tape together:
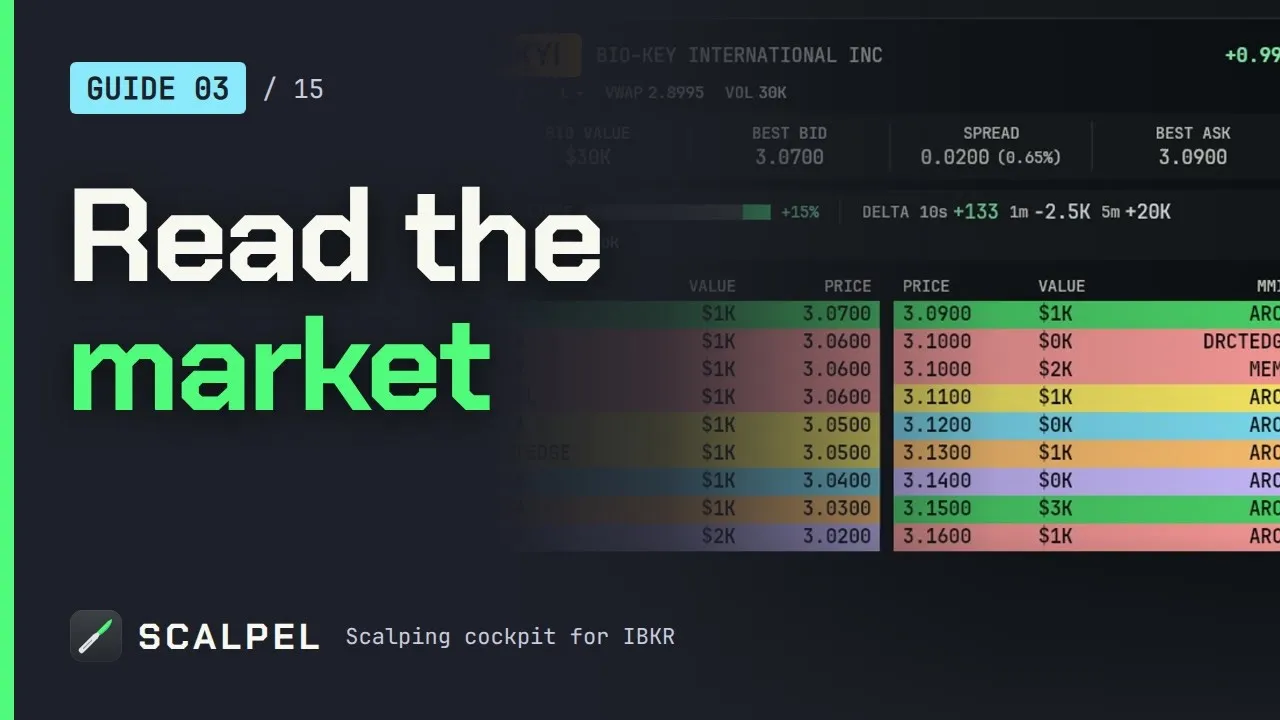
Scalpel is long only, and its stops are app-monitored rather than resting orders at IBKR, so they only work while Scalpel runs with a live feed (how stops work). Where TWS is the better choice: if you trade options, futures or short, or you want a library of a hundred studies, TWS and its TradingView-powered advanced chart do far more.
Every post on charts and setups
The charts and setups hub lists the whole cluster. In reading order:
- VWAP for day trading: the formula, the 04:00 versus 09:30 anchor, a worked computation, and how traders read reclaims and losses.
- The 9 and 20 EMA for day trading: the EMA formula with real numbers, why 9 and 20, using them as a trend filter on 1 and 5-minute charts, and their limits.
- MACD for day trading: 12, 26, 9 and where it came from, the histogram, crossovers, lag, and using MACD as a filter.
- The bull flag pattern: pole, flag, volume, entry on the break, stop and target in small caps.
- Candlestick patterns for day trading: the doji, hammer, shooting star, engulfing bar and topping tail, and why context beats shape.
- The best timeframe for scalping: 10-second, 1-minute and 5-minute charts compared, noise, tick charts and pairing a fast chart with a slow one.
- Whole and half dollar levels: the round number research, sellers stacked at whole dollars, and where not to put your stop.
Research and product details checked on October 22, 2026. Scalpel is independent and not affiliated with or endorsed by Interactive Brokers or TradingView.
Trading carries a significant risk of loss. Nothing here is financial advice.
Questions
- What is the best chart setup for day trading?
- A small one: candlesticks on a 1-minute chart with a 5-minute chart for context, volume, VWAP, the 9 and 20 EMAs, and horizontal levels such as the pre-market high, the high of day and whole and half dollars. MACD is optional as a filter.
- What are the best indicators for day trading?
- Volume, VWAP and the 9 and 20 EMAs cover most of what a day trader needs. They describe what price has done; none predicts. Research on intraday indicator rules found none profitable once data snooping was accounted for, so use them to plan entries and stops.
- What timeframe should I use for day trading?
- Most momentum day traders use a 1-minute chart for timing and a 5-minute chart for context. Scalpers on fast small caps often time entries on a 10-second chart. Two charts per stock is enough.
- Should VWAP start at 04:00 or 09:30?
- For a stock that gapped and traded heavily before the open, a VWAP from the 04:00 ET pre-market open counts the buyers who built the gap. A VWAP from 09:30 ignores them. Check which one your platform draws.
- Do I need a TradingView subscription to chart with Interactive Brokers?
- No. TWS has its own charts, including an advanced chart powered by TradingView, with IBKR market data. You only need the market data subscriptions for the stocks you trade.
- Do technical indicators work for day trading?
- The evidence is weak. A 2007 review found 56 of 95 studies positive but most flawed by data snooping, and a 2008 test of 7,846 intraday rules found none profitable after correcting for it. Indicators help you read the chart, not beat the market.
Related guides
Guide 3.5The chart: timeframes, VWAP, EMAs, MACD and deltaScalpel's chart on IBKR data, no TradingView subscription: 10s to daily bars, scroll-back history, VWAP from 04:00 ET, EMA 9 and 20, MACD and delta.Guide 2.3Panel settings: Level 2, tape and chartEvery option behind the Level 2 and chart cogs: rows, colouring, dollar values, the tape column, trade bubbles, gridlines and the warning switches.Guide 3.6The read line and the chart read barWhat Scalpel's read line and chart read bar say, the three reads that held up in replay (ask-heavy book, bull trap, lost VWAP) and the calls removed.
Keep reading
- VWAP for day trading: what it is and how traders use itVWAP for day trading explained: the formula with a worked example, why 04:00 and 09:30 anchors differ, how institutions use it, and how traders read it.
- The 9 and 20 EMA for day trading: formula, lag and how to use themThe 9 and 20 EMA for day trading: the formula worked with real numbers, how much each bar counts, how traders use the pair, and what the research found.
- MACD for day trading: settings and how to read itMACD for day trading: what 12, 26, 9 measures, a worked crossover example, why it lags, and how to use MACD as a filter instead of a buy signal.
Practice in SIM, against the live book.A lifetime license, every update included, with a 7-day refund guarantee.Ask in DiscordGet Scalpel