VWAP for day trading: what it is and how traders use it
By Scalpel Team. , updated . 8 min read.
In short
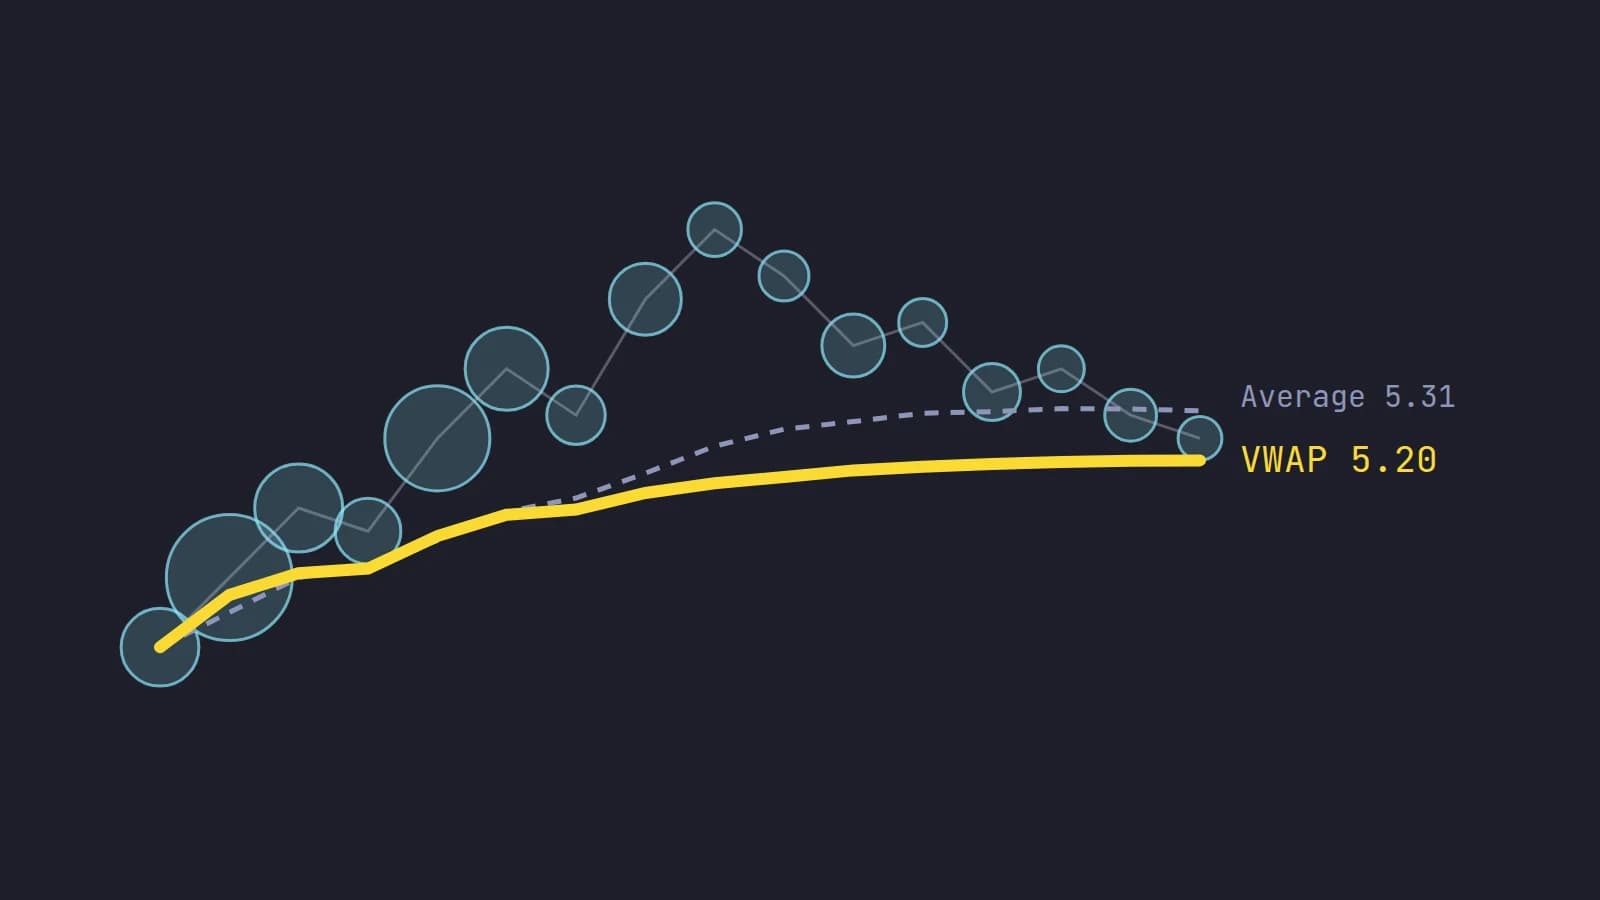
VWAP (volume-weighted average price) is the average price paid for every share traded since the session began: add up price times volume for each bar, then divide by total volume. In day trading it answers one question, whether the average buyer today is in profit. Price above VWAP means today's buyers are mostly green; a close back under it means many are now holding a loss. Traders watch VWAP reclaims and losses, but VWAP describes the day so far; it does not predict the next move.
VWAP is the one line nearly every momentum day trader keeps on the chart. It is also the one most often misread, because two platforms can draw it in two different places on the same stock: one starts counting at 04:00 ET, the other at 09:30. This post covers what VWAP is, the formula with a worked computation, why the start time matters, how institutions use it, and how day traders read it.
What is VWAP?
VWAP is a running average of price, weighted by how many shares traded at each price. A minute in which 120,000 shares changed hands counts six times as much as a minute with 20,000.
For each bar, take a representative price (most charting tools, ours included, use the typical price: high plus low plus close, divided by 3), multiply it by the bar's volume, and keep running totals from the start of the session:
VWAP = (sum of typical price x volume) / (sum of volume)
Computed from every individual trade instead of bars, it is exactly the average price paid per share. Computed from 1-minute bars, it is a close approximation. Either way it resets each session and only ever looks back.
VWAP started life as an execution benchmark, not a chart indicator. Berkowitz, Logue and Noser used a volume-weighted average of the day's trade prices as the yardstick for the cost of trading on the NYSE in The Total Cost of Transactions on the NYSE (Journal of Finance, 1988), on the reasoning that it approximates the price a trader with no special timing would get. That is still how institutions use it: did our broker buy the 2 million shares better or worse than the day's VWAP?
How to calculate VWAP: a worked example
Here are the first five 1-minute bars of a session on a fictional stock, WXYZ.
| Bar | High | Low | Close | Typical price | Volume | Price x volume | Running VWAP |
|---|---|---|---|---|---|---|---|
| 1 | 5.12 | 4.96 | 5.04 | 5.04 | 40,000 | 201,600 | 5.0400 |
| 2 | 5.20 | 5.02 | 5.17 | 5.13 | 120,000 | 615,600 | 5.1075 |
| 3 | 5.26 | 5.11 | 5.14 | 5.17 | 30,000 | 155,100 | 5.1174 |
| 4 | 5.15 | 4.99 | 5.01 | 5.05 | 50,000 | 252,500 | 5.1033 |
| 5 | 5.10 | 5.00 | 5.08 | 5.06 | 20,000 | 101,200 | 5.1000 |
Take bar 3. The running totals are 201,600 + 615,600 + 155,100 = 972,300 dollars of trading over 40,000 + 120,000 + 30,000 = 190,000 shares, so VWAP = 972,300 / 190,000 = 5.1174.
Two things to notice. First, the simple average of the five typical prices is 5.09, but VWAP is 5.10: the heavy second bar, 120,000 shares at about 5.13, pulls it up. That is the point of the weighting. Second, after bar 5 the stock closes at 5.08, two cents under VWAP. The 160,000 shares bought in bars 2 to 4 at an average above 5.08 are, on average, slightly under water.
As the day goes on, each new bar is a smaller share of the total, so VWAP moves less and less. In the first minutes it can swing by cents per bar; by the afternoon, a single minute barely moves it.
When VWAP starts: 04:00 or 09:30
The formula has one setting that changes everything: the anchor, the moment the running totals start. Nasdaq's pre-market session opens at 04:00 ET and regular trading at 09:30 ET. Many charting tools start VWAP at 09:30; others, including Scalpel, start at 04:00.
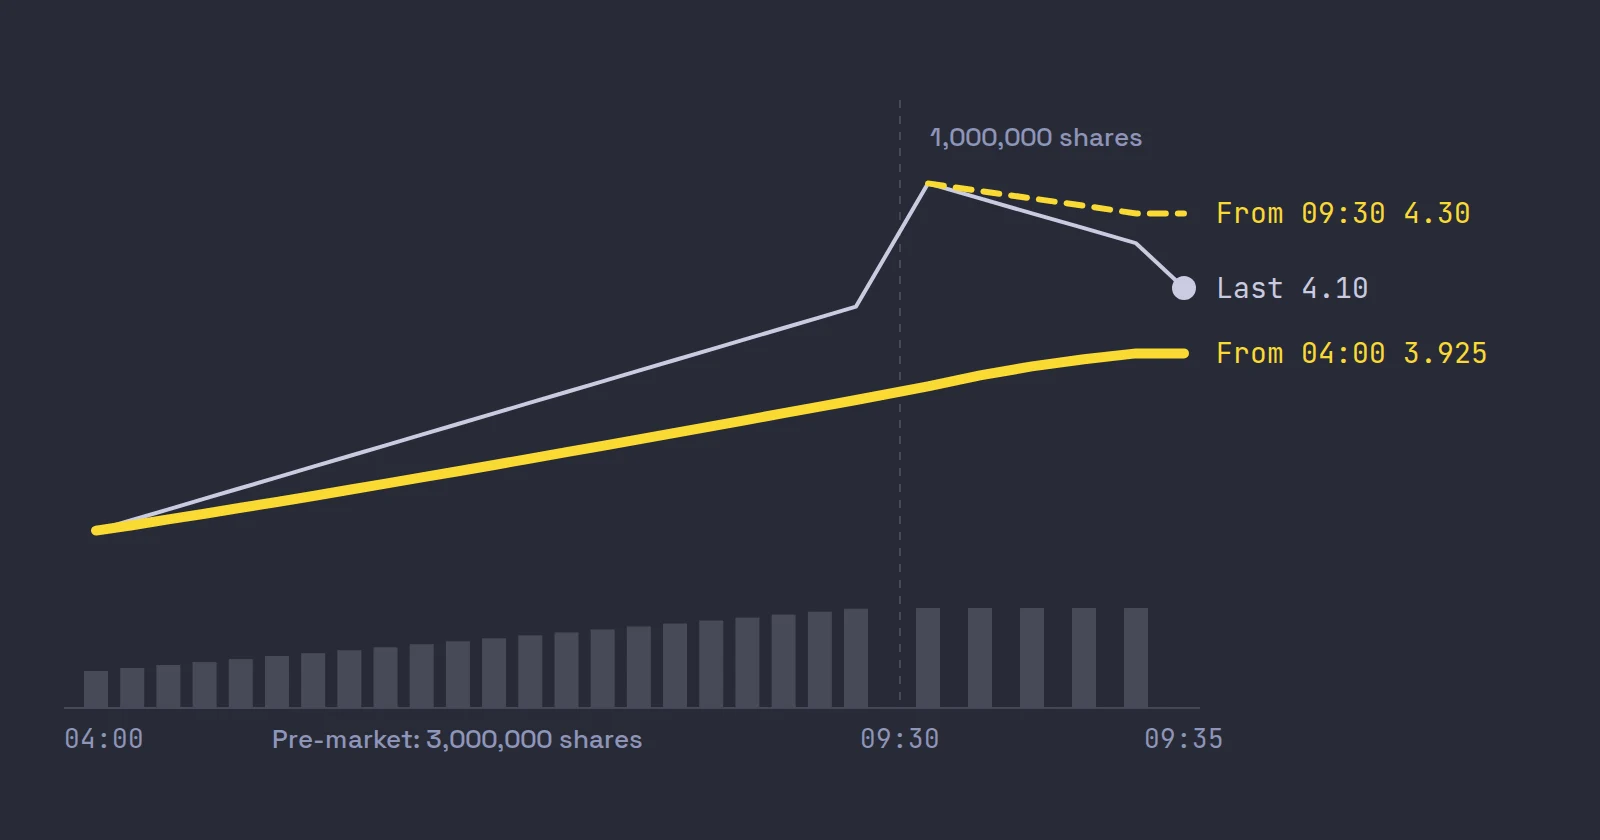
For a large cap with little pre-market volume, the difference is small. For a small cap that gapped on news, it can be large, as in this example on a fictional ABCD:
| Shares | Average price | |
|---|---|---|
| 04:00 to 09:30 (pre-market) | 3,000,000 | $3.80 |
| 09:30 to 09:35 | 1,000,000 | $4.30 |
- VWAP from 09:30 at 09:35: $4.30, because it only knows the last five minutes.
- VWAP from 04:00 at 09:35: (3,000,000 x 3.80 + 1,000,000 x 4.30) / 4,000,000 = (11,400,000 + 4,300,000) / 4,000,000 = $3.925.
Now say ABCD trades at $4.10. On the 09:30 chart it is 20 cents under VWAP and looks weak. On the 04:00 chart it is 17.5 cents above VWAP: the three million shares bought before the open are still in profit, on average. Same stock, same second, opposite reads.
Neither is wrong. They describe different groups of buyers. For a pre-market gapper, our view is that the 04:00 line is the more honest one, because the people who bought the gap are the ones who will sell if it fails. Whichever you use, know which one your platform draws. In TWS, VWAP is added from the Additional Data section of Edit > Chart Parameters (IBKR's chart lesson); compare its value at 09:31 with your own calculation on a stock that traded heavily before the open.
How institutions use VWAP
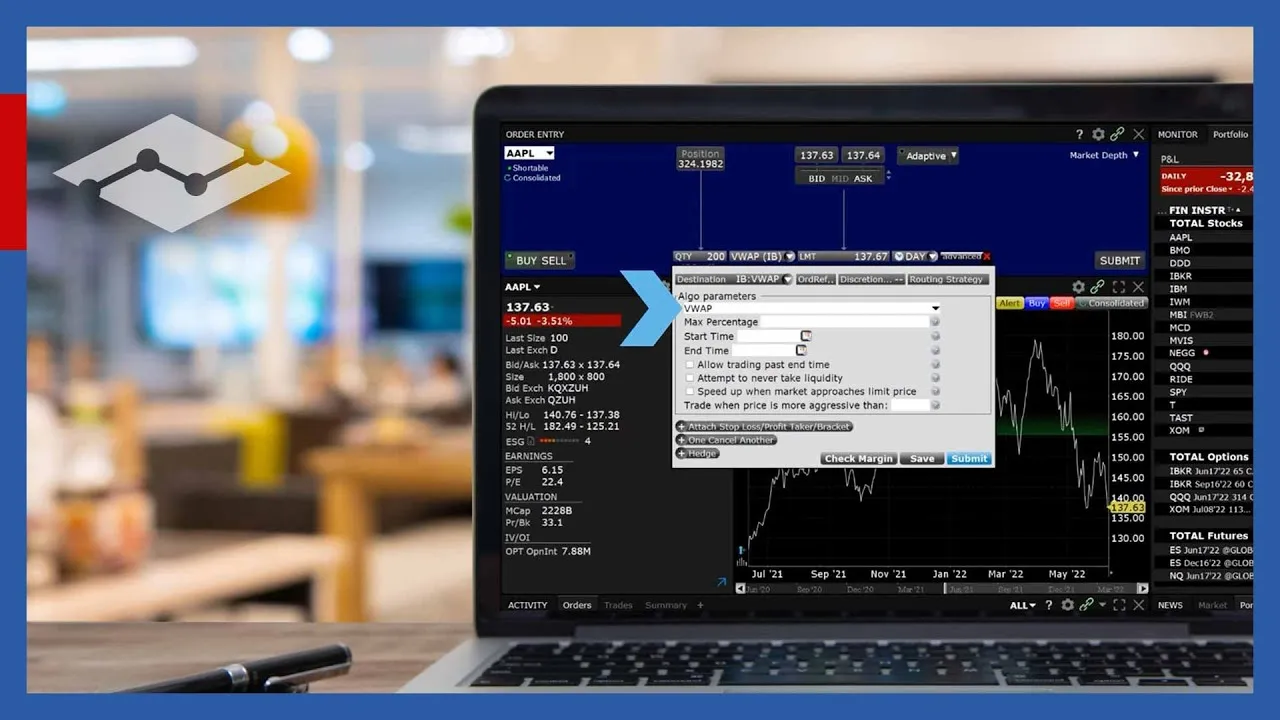
Because VWAP is the benchmark, there are algorithms whose whole job is to match it. Interactive Brokers' VWAP (Best-Efforts) algo slices an order through the day to get close to the volume-weighted price from the time it is sent to the close, and lets the user cap the order at up to 50% of average daily volume. IBKR is clear that it does not guarantee the benchmark price and that there is likely to be a deviation, positive or negative.
IBKR's short video shows how the algo is set up in TWS, which is a good way to see VWAP from the other side of the trade:
Two things follow for a day trader. First, large VWAP-benchmarked orders are real: a fund buying through the day has a reason to buy more when price is below VWAP and less when it is above. That is one plausible reason the line attracts activity. Second, the day's final VWAP includes the close, and the close is big. In the second quarter of 2024, US closing auctions matched $55.5 billion a day, 9.44% of total notional value traded, according to the NYSE. The VWAP you see at 10:00 is not the number a fund will be measured against at 16:00.
VWAP day trading: how traders read it
Here is what traders mean by the common VWAP phrases, and what each describes.
| Read | What it describes | What traders do with it |
|---|---|---|
| Holding above VWAP | Today's average buyer is in profit and pullbacks are being bought before they reach it | Treat longs as with the trend; some use VWAP as the line a pullback should not lose |
| VWAP reclaim | Price was below, closes back above: the buyers under water are back to even | Some traders buy the first pullback that holds above it, stop under VWAP |
| VWAP loss | Price was above, closes back below: today's buyers are now under water | Longs tighten or exit; new longs wait |
| Extended from VWAP | Price far above the average, for example 15% on a gapper | Expect pullbacks; buying here means a wide stop or a poor reward to risk |
A VWAP strategy in its simplest form is the reclaim: wait for a close back above VWAP, then buy the first pullback that holds it, with the stop a few cents under the line. The appeal is the obvious stop. The problem is chop: on a stock going sideways around VWAP, you get reclaim after loss after reclaim, and each one is a small loss.
What does the evidence say? There is little peer-reviewed work on VWAP crosses as an intraday signal. The closest broad test is Marshall, Cahan and Cahan, who ran 7,846 popular technical trading rules on intraday US equity data and found none profitable once data snooping was accounted for (Journal of Empirical Finance, 2008). We replayed our own chart reads over recorded sessions when we built Scalpel's read bar. A close back under VWAP right after a close above it was one of only two chart reads where price tended to follow through (it tended to keep falling); most of what we tested did no better than a coin flip. That is a description of our replays, not a promise about your next trade.
So use VWAP as context and as a stop reference, not as a buy signal. A long above VWAP with the 9 EMA rising is a long with the day's flow; our post on the 9 and 20 EMA covers that second layer. A long below VWAP is a bet that today's trapped buyers will not sell into your bounce.
Where VWAP misleads
- The first minutes. With little volume in the totals, VWAP jumps around. A reclaim at 09:32 on the 09:30 line means less than one at 10:30.
- Late in the day. VWAP is nearly flat after a few hours of volume, so price can be far from it for good reason.
- Thin stocks. On a stock trading a few thousand shares a minute, a single block can drag VWAP and the line means little.
- Halts. After a volatility halt the reopening print can be far from VWAP and the line takes time to catch up, and a stop just under VWAP is not a guaranteed exit across a halt. See where to put your stop loss when day trading.
- Different numbers on different screens. Anchor, the price used (typical price, close, or every trade) and whether pre-market trades count all change the value. A few cents of difference between two platforms is normal.
VWAP also ignores where the volume sat on the book. Whole and half dollars often matter as much; see whole and half dollar levels. If you prefer a momentum read instead of an average, MACD for day trading covers the most common one.
Where Scalpel fits
Scalpel draws VWAP as a thick yellow line on every desk's chart, anchored at 04:00 ET so pre-market volume counts all day; before 04:00 it starts from the overnight session at 20:00 ET the evening before. It is computed from 1-minute bars with the typical price, exactly as in the table above, then drawn on whatever timeframe you view, so the 10-second and 5-minute charts show the same line (chart basics). The scanner rows show a VWAP dot for whether each stock is above or below the same line (premarket scanning).
Above the chart, the read bar states Above VWAP or Below VWAP as plain fact, and raises Lost VWAP in salmon when a bar closes back under VWAP right after a close at or above it:
The warning is a note, not an order: Scalpel never trades for you. What you do with it, such as moving the stop to breakeven, is your plan (read line and read bar, drag stops and targets). The term is also in the glossary, and our glossary video runs through it with the other terms on the desk:
Scalpel is long only, and its stops are app-monitored, so they only work while Scalpel runs with a live feed. For the full chart setup VWAP sits in, see our pillar on the best chart setup for day trading.
Sources and IBKR details checked on October 22, 2026. Scalpel is independent and not affiliated with or endorsed by Interactive Brokers.
Trading carries a significant risk of loss. Nothing here is financial advice.
Questions
- What is VWAP in day trading?
- VWAP is the volume-weighted average price: the average price paid for every share traded since the session began. Day traders use it to see whether today's average buyer is in profit (price above VWAP) or holding a loss (price below).
- How is VWAP calculated?
- For each bar, multiply a representative price, usually the typical price (high plus low plus close, divided by 3), by the bar's volume. Keep running totals from the session start and divide the total of price times volume by the total volume.
- Does VWAP include pre-market?
- It depends on the platform. Many start VWAP at the 09:30 ET open; others, including Scalpel, start at the 04:00 ET pre-market open. On a stock that gapped and traded heavily before the open, the two can be far apart.
- Is VWAP a good day trading strategy?
- VWAP is context, not a strategy on its own. Traders use reclaims and losses of VWAP to frame entries and stops, but broad tests of intraday technical rules have found none profitable after correcting for data snooping.
- Why is my VWAP different from another platform's?
- The anchor time, whether pre-market trades count, and the price used for each bar all change the value. A few cents of difference is normal; a large gap on a gapper usually means one line starts at 04:00 and the other at 09:30.
Related guides
Guide 3.5The chart: timeframes, VWAP, EMAs, MACD and deltaScalpel's chart on IBKR data, no TradingView subscription: 10s to daily bars, scroll-back history, VWAP from 04:00 ET, EMA 9 and 20, MACD and delta.Guide 3.6The read line and the chart read barWhat Scalpel's read line and chart read bar say, the three reads that held up in replay (ask-heavy book, bull trap, lost VWAP) and the calls removed.Guide 8.3Scan the pre-marketScan pre-market movers from 04:00 ET in Scalpel: what the gainers, volume spike and gap scans show before the open, gap and go, and what changes at 09:30.
Keep reading
- The best chart setup for day trading: timeframes and indicatorsThe best chart setup for day trading: 1 and 5-minute candles, volume, VWAP, the 9 and 20 EMA and key levels, plus what research says about indicators.
- The 9 and 20 EMA for day trading: formula, lag and how to use themThe 9 and 20 EMA for day trading: the formula worked with real numbers, how much each bar counts, how traders use the pair, and what the research found.
- MACD for day trading: settings and how to read itMACD for day trading: what 12, 26, 9 measures, a worked crossover example, why it lags, and how to use MACD as a filter instead of a buy signal.
Practice in SIM, against the live book.A lifetime license, every update included, with a 7-day refund guarantee.Ask in DiscordGet Scalpel