Candlestick patterns for day trading that are worth knowing
By Scalpel Team. , updated . 9 min read.
In short
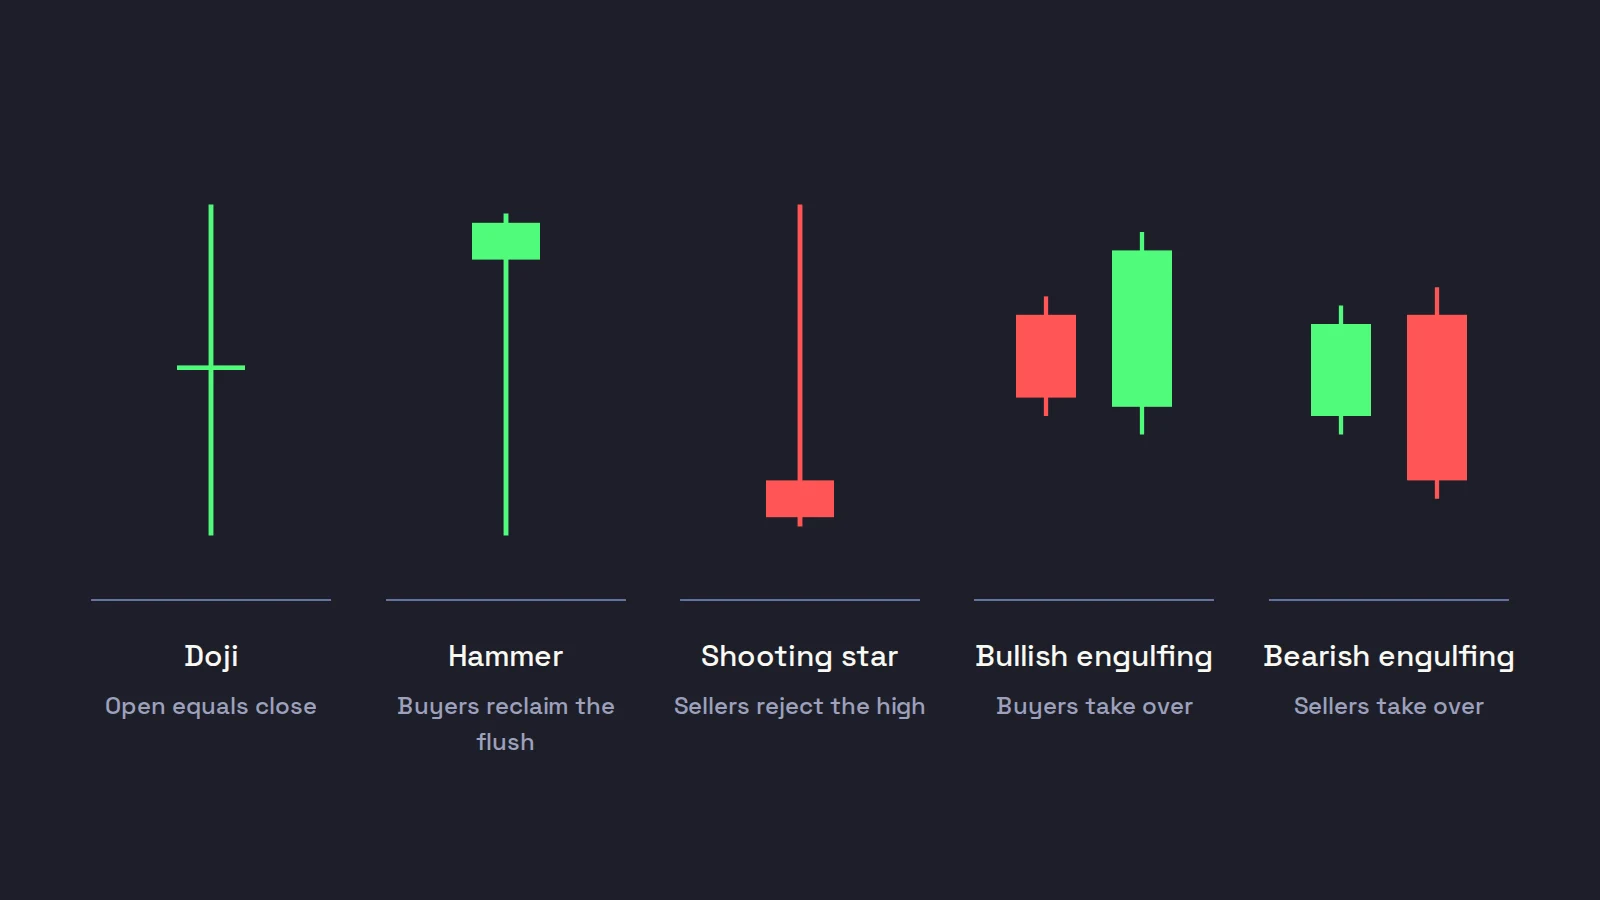
The candlestick patterns for day trading worth knowing are few: the doji, the hammer, the shooting star (a topping tail on an intraday chart) and the bullish and bearish engulfing. Each one describes a fight between buyers and sellers inside one or two candles; none of them predicts the next move on its own. The research is unkind to candles used alone, so read them only where they form, at VWAP, a high of day or a whole dollar, and let the next candle confirm.
Search for candlestick patterns and you will find lists of 40, 60 or 100 of them, each with a dramatic name. Most of them were described on daily charts of rice and later stocks, where every candle opens after a night of news. On a 1-minute chart of a small cap, half of those patterns barely exist, and the rest mean less than their names suggest.
This post keeps the handful of day trading candlestick patterns that show up constantly intraday, explains what each one says about the order flow behind it, and puts numbers on how much weight they deserve. We build a trading cockpit on the Interactive Brokers API, and we chose to label these candles as plain facts rather than signals. The evidence below is why.
How to read one candle
A candle summarizes every trade in its time window. The body runs from the open to the close: green if the close is higher, red if lower. The wicks (or shadows) mark the high and the low. On a 1-minute chart, one candle is one minute of trading; on a 10-second chart, the same minute is six candles.
The wicks are where the story is. A long lower wick means sellers pushed price down during the candle and buyers pushed it back. A long upper wick means the opposite: buyers tried, and sellers won by the close. A small body with long wicks on both sides means neither side finished ahead.
Candlestick patterns for day trading that are worth knowing
Doji
Open and close at or near the same price, with wicks on one or both sides. A doji says buyers and sellers ended the candle even. Example: ABCD opens a 1-minute candle at 6.10, trades between 6.02 and 6.19, and closes at 6.11. One cent of body on a 17-cent range.
What it means depends on where it is. After a run of six green candles, a doji at the high is the first candle where buyers did not win, which is worth noticing. In the middle of a sideways range it means nothing at all: every other candle there is a near-doji.
Hammer
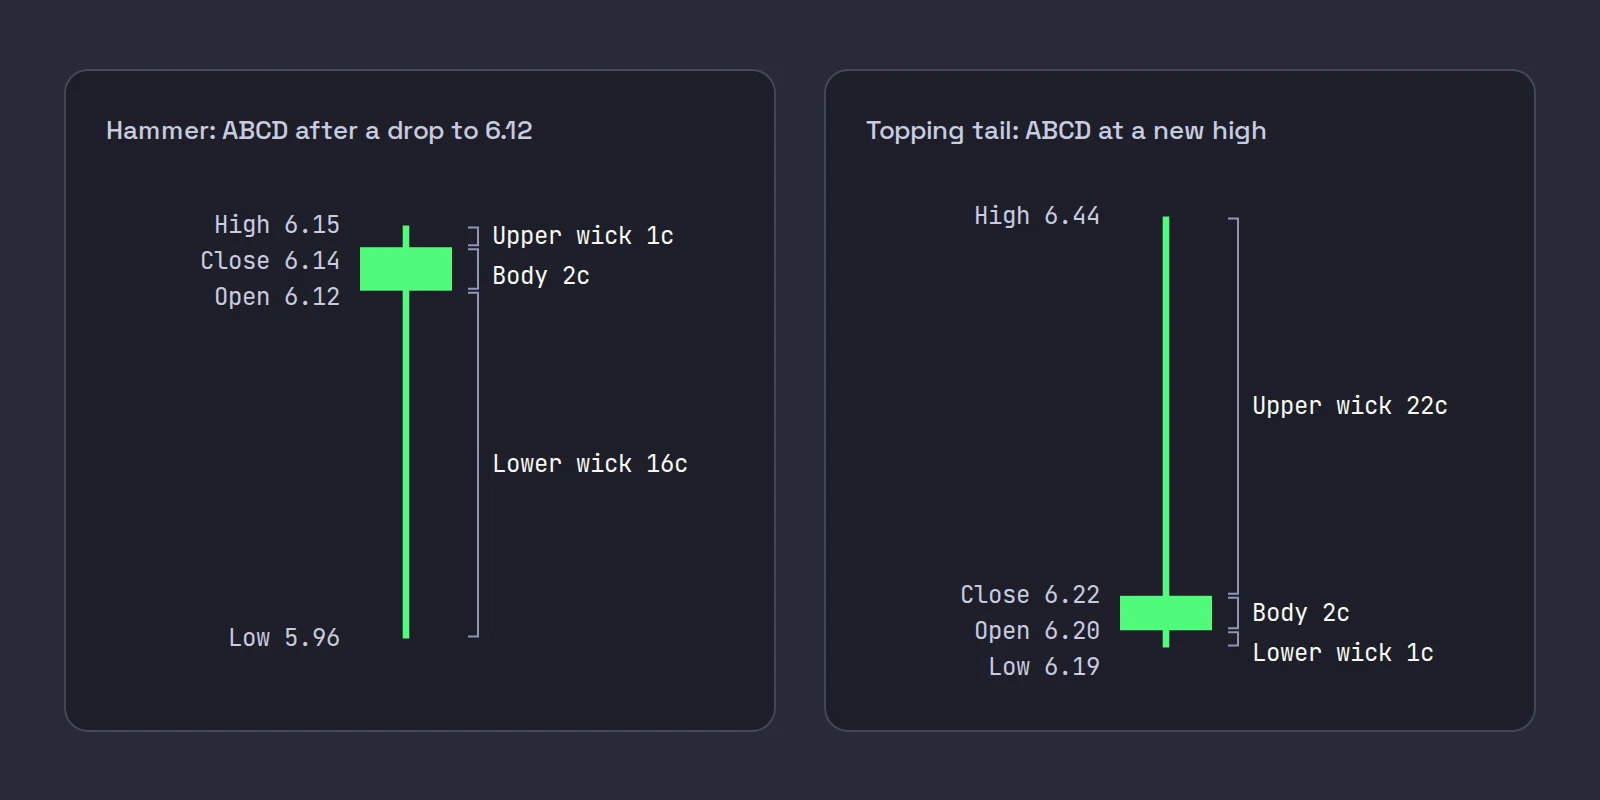
A small body near the top of the candle and a lower wick at least twice the body's height, after a move down. Example: ABCD drops from 6.40 to 6.12, then prints a candle that opens at 6.12, trades down to 5.96, and closes at 6.14. The 16-cent lower wick against a 2-cent body says sellers pushed it under 6.00 and buyers took it straight back.
A hammer candle is the classic "flush and reclaim" bar, and in small caps it often forms at a level where buyers were waiting: VWAP, the morning's breakout level or a whole dollar.
Shooting star and topping tail
The mirror image: a small body near the bottom of the candle and a long upper wick, after a move up. Intraday momentum traders usually call a long upper wick at a high a topping tail. Example: ABCD runs from 5.60 to 6.20, then prints a candle that opens at 6.20, reaches 6.44 and closes at 6.22. Buyers got to 6.44, and sellers pushed price 22 cents back down before the minute ended.
If you are long, a topping tail at a new high of day is a reason to tighten your stop or take some off. It is not, on its own, a reason to expect a collapse. Our post on high of day breakouts covers how often breaks above the high get rejected exactly like this.
Bullish and bearish engulfing
Two candles: the second candle's body covers the whole body of the first, in the opposite color. A bullish engulfing is a red candle followed by a bigger green one; a bearish engulfing is a green candle followed by a bigger red one.
Intraday, there is a catch. On a daily chart the second candle often opens with a gap, and engulfing means something about the overnight session. On a 1-minute chart each candle opens almost exactly where the last one closed, so "engulfing" usually just means the second candle moved further than the first. That is still information (momentum flipped), but much less than the name suggests.
Patterns that barely exist intraday
Morning stars, evening stars, abandoned babies and most "star" patterns require a gap between candles. Intraday candles of an active stock rarely gap, except at the open or after a trading halt. If a pattern needs a gap, do not look for it on a 1-minute chart.
What the statistics say
The best-known numbers on single candles come from Thomas Bulkowski, who tested each pattern for how often price broke out in the expected direction, and ranked them out of 103 by how far price moved afterward (1 is best).
| Pattern | Expected | Bulkowski's tested result | Overall rank (of 103) |
|---|---|---|---|
| Hammer | Bullish reversal | Bullish reversal 60% of the time | 65 |
| Shooting star | Bearish reversal | Bearish reversal 59% of the time | 55 |
| Bullish engulfing | Bullish reversal | Bullish reversal 63% of the time | 84 |
| Bearish engulfing | Bearish reversal | Bearish reversal 79% of the time | 91 |
| Long-legged doji | Indecision | Bullish continuation 51% of the time | 37 |
Two things stand out. First, the direction calls hover near a coin flip for the hammer, the shooting star and the doji; Bulkowski himself calls the hammer's 60% "not far from random (50%)". Second, a good direction rate does not mean a good move: the bearish engulfing breaks down 79% of the time but ranks 91 of 103 for what happens after. And on the shooting star page he adds that day traders rely on it more than he thinks they should, because "my statistics are based on the daily charts, not intra day ones."
The academic work is more direct:
- Daily candles on large US stocks. Ben Marshall's doctoral work, published with Young and Rose in the Journal of Banking and Finance in 2006, tested candlestick strategies on Dow Jones Industrial Average stocks from 1992 to 2002 and concluded that "there is no evidence that a trader adhering to candlestick technical analysis would out-perform the market" (Massey University thesis record).
- 5-minute candles, the closest thing to day trading. Duvinage, Mazza and Petitjean (2013) tested candlestick rules on 5-minute bars of the 30 Dow stocks. About a third of the rules beat buy-and-hold before costs. After trading costs only a few remained, and after correcting for data snooping, no single rule beat buy-and-hold (Quantitative Finance 13(7), doi:10.1080/14697688.2013.768774).
- A more positive result. Lu and Shiu (2016) tested every possible 1-day pattern on the 30 Dow stocks from January 1974 to December 2009 and found that "several of the patterns may well prove to be profitable", with predictive power rising after 1992 (Applied Economics 48(35), doi:10.1080/00036846.2015.1137553).
None of these studies looked at $3 small caps on 1-minute candles, and the evidence they do give is mixed at best. Our conclusion: a candle tells you what happened in the last minute, honestly and quickly. It does not carry enough information to trade on alone.
Context beats the candle
The same candle means different things in different places. Here is the same hammer twice.
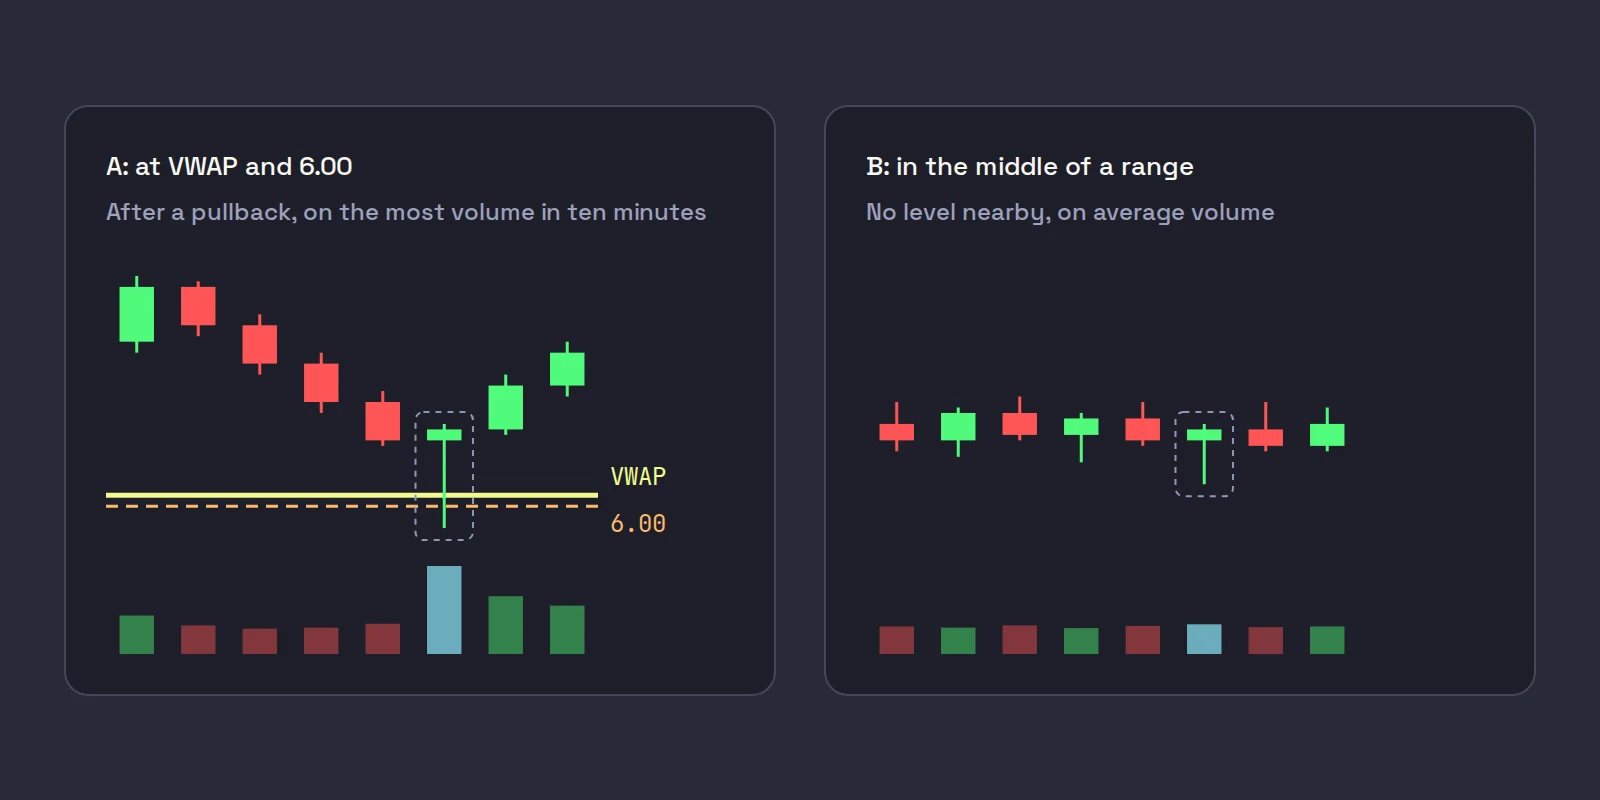
Hammer A forms after a pullback from the morning high, right on VWAP, with its low poking a few cents under 6.00 and closing back above it. Volume on the candle is the highest in ten minutes. Buyers defended a level that matters to everyone watching. A trader taking this has an obvious stop: a few cents under the hammer's low.
Hammer B forms in the middle of a 20-minute sideways range, on average volume, nowhere near VWAP or a round number. It is the same shape, and it means almost nothing.
Before you act on any candle, check three things:
- Where is it? At VWAP, a prior high, the pre-market high or a whole or half dollar, a reversal candle is a real event. In the middle of nowhere, it is noise. See our posts on VWAP for day trading and whole and half dollar levels.
- What did volume do? A hammer on three times the recent volume shows real buyers. A hammer on a trickle of shares shows that nobody was selling hard, which is weaker.
- What does the next candle do? A hammer followed by a candle that takes out its high has confirmed. A hammer followed by a candle that breaks its low has failed, and the failure itself is information. Waiting one candle costs you some price and saves you a lot of bad entries.
The tape adds a fourth check. A topping tail with the time and sales showing heavy red prints at the bid is sellers actually selling; the same wick on thin prints may be a single buyer who stopped buying. Our post on tape reading covers what to look for.
Day trading candlestick patterns on a 1-minute chart
A few practical points that apply to every pattern above:
- Wait for the close. A candle is not a hammer until its minute is over. Halfway through, it can still turn into a big red bar.
- The timeframe changes the pattern. A 1-minute hammer is six 10-second candles that might read as a flush and a rally. A 5-minute bar might swallow it entirely. Pick a timeframe for entries and stick to it (best timeframe for scalping).
- Let the pattern set the stop, not the hope. A hammer's low and a topping tail's high are natural invalidation points. If a trade based on a hammer goes under the hammer's low, the reason for the trade is gone.
- Use candles to manage, more than to enter. For a long, a topping tail at a new high or a bearish engulfing after a run is a fair reason to take some off or move the stop to breakeven. That is a smaller claim than "this candle predicts a drop", and a more defensible one.
For a refresher on chart types, IBKR's Traders' Academy has a short lesson on candlestick, line and bar charts, built from CME Group's study notes.
If you chart in TWS, IBKR's lesson shows how to open a chart, change its time period and switch the display between candlesticks, bars and lines, so you can set up the 1-minute candles this post assumes.
Where Scalpel fits
Scalpel is a keyboard-first desktop cockpit for your own IBKR account, with a chart on every desk. Above each chart sits a read bar that states the facts of the recent candles in plain words: above or below VWAP, the EMAs up or down, and a short detail such as Shooting star, Doji, 3 green bars or Broke the range high (read line and read bar).
Those candle names are shown in plain text on purpose. When the reads were replayed over recorded sessions, most calls did no better than a coin flip, so only two chart reads are colored as warnings: a Bull trap (a break above the recent high that closes back under it, after which price tended to dip over the next 30 to 60 seconds) and Lost VWAP.
With a long open, Scalpel also watches closed 1-minute bars for that bull trap and warns you with a toast and a voice callout. It does nothing to your position: what you do with the warning is your plan. The chart itself is covered in chart basics, and the patterns Scalpel's scanner does detect (bull flag, micro pullback, flat top) in the momentum method.
This video walks through the chart, the read bar and the Level 2 reads:
For the whole chart setup these candles sit in, see the best chart setup for day trading, and for a pattern built from several candles, the bull flag. Scalpel is independent and not affiliated with or endorsed by Interactive Brokers or Thomas Bulkowski. Sources checked on October 22, 2026.
Trading carries a significant risk of loss. Nothing here is financial advice.
Questions
- What are the best candlestick patterns for day trading?
- The ones that form constantly on intraday charts: the doji, the hammer, the shooting star or topping tail, and the bullish and bearish engulfing. They are most useful at levels such as VWAP, the high of day or a whole dollar, and least useful in the middle of a range.
- Do candlestick patterns work for day trading?
- Not on their own, according to the published evidence. A study of 5-minute candles on the 30 Dow stocks found that no single candlestick rule beat buy-and-hold after trading costs and a correction for data snooping. Candles are better used for context and trade management.
- What does a doji candle mean?
- The open and close are at or near the same price, so buyers and sellers finished the candle even. After a strong run it can mark the first loss of momentum; in a sideways range it means very little.
- What is a hammer candle?
- A candle with a small body near its high and a lower wick at least twice the body's height, after a move down. It shows sellers pushed price down and buyers pushed it back up before the close.
- What is a topping tail in day trading?
- A candle with a long upper wick at or near a high: buyers pushed price up and sellers drove it back down before the close. It is the intraday name for a shooting star, and longs often use it as a reason to tighten stops or take profits.
- Which timeframe should I use for candlestick patterns?
- Use the timeframe you make decisions on, usually the 1-minute chart for small-cap day trading. A pattern on one timeframe can disappear on another, so do not switch charts looking for a pattern you want to see.
Related guides
Guide 3.5The chart: timeframes, VWAP, EMAs, MACD and deltaScalpel's chart on IBKR data, no TradingView subscription: 10s to daily bars, scroll-back history, VWAP from 04:00 ET, EMA 9 and 20, MACD and delta.Guide 3.6The read line and the chart read barWhat Scalpel's read line and chart read bar say, the three reads that held up in replay (ask-heavy book, bull trap, lost VWAP) and the calls removed.Guide 14.6The momentum method Scalpel is built aroundThe small-cap momentum style Ross Cameron teaches, from stock selection to gap and go and micro pullbacks, mapped to Scalpel's scanner, intel and stops.
Keep reading
- The best chart setup for day trading: timeframes and indicatorsThe best chart setup for day trading: 1 and 5-minute candles, volume, VWAP, the 9 and 20 EMA and key levels, plus what research says about indicators.
- VWAP for day trading: what it is and how traders use itVWAP for day trading explained: the formula with a worked example, why 04:00 and 09:30 anchors differ, how institutions use it, and how traders read it.
- The 9 and 20 EMA for day trading: formula, lag and how to use themThe 9 and 20 EMA for day trading: the formula worked with real numbers, how much each bar counts, how traders use the pair, and what the research found.
Practice in SIM, against the live book.A lifetime license, every update included, with a 7-day refund guarantee.Ask in DiscordGet Scalpel