MACD for day trading: settings and how to read it
By Scalpel Team. , updated . 8 min read.
In short
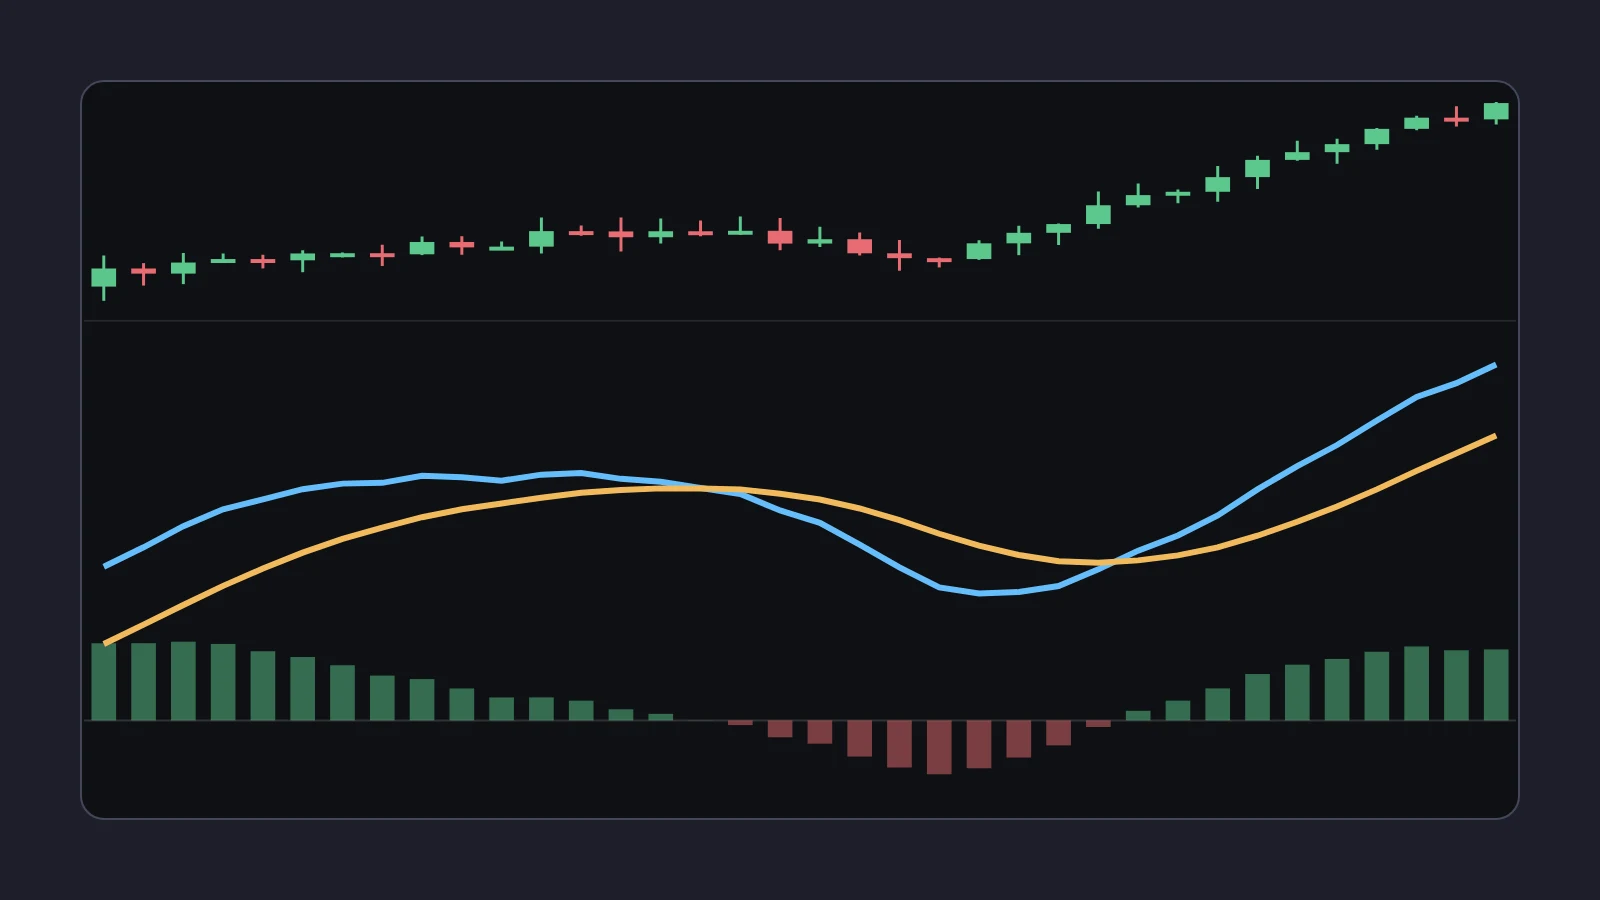
MACD is the 12-period EMA minus the 26-period EMA; a 9-period EMA of that line is the signal line, and the histogram is the gap between the two. For day trading, the standard 12, 26, 9 settings work on 1-minute and 5-minute charts. Read it as a measure of whether a move is gaining or losing speed, and use it as a filter: a reason to skip or size down a long when momentum is fading, not a reason to buy. MACD lags by construction, crossovers come after the turn, and research on MACD rules shows mixed results that do not hold up across markets.
MACD (moving average convergence divergence) sits under the price chart on a huge share of day trading screens, usually at its default 12, 26, 9. It is also the indicator people most often trade directly: buy the crossover, sell the cross back. This post explains what the three parts of MACD measure, works through the numbers, covers the settings, and makes the case for using it as a filter instead of a trigger.
What the MACD indicator measures
Gerald Appel created MACD in the late 1970s (background on Wikipedia). It has three parts, all built from exponential moving averages (EMAs) of the closes:
| Part | Formula | What it describes |
|---|---|---|
| MACD line | 12 EMA minus 26 EMA | How far the short-term average is above or below the longer one: positive in an uptrend |
| Signal line | 9 EMA of the MACD line | A smoothed, slower copy of the MACD line |
| Histogram | MACD line minus signal line | Whether the MACD line is pulling away from its own average (speeding up) or falling back (slowing) |
IBKR's guide to short-term chart indicators in TWS gives the same three formulas: MACD = MA(close, 12) - MA(close, 26), signal = EMA(MACD, 9), histogram = MACD - signal.
A useful way to think about it: the MACD line is a smoothed speed of the trend, and the histogram is a smoothed change in that speed. When a stock is still rising but rising less quickly, the histogram shrinks first. That is the one thing MACD shows that the 9 and 20 EMAs on the price chart do not show as clearly.
A worked MACD computation
The EMA weights are k = 2 / (N + 1): 0.1538 for the 12 EMA, 0.0741 for the 26 and 0.2 for the 9-period signal. Say a fictional stock, WXYZ, has been rising on a 1-minute chart, with a 12 EMA of 5.2000, a 26 EMA of 5.0800, so a MACD line of 0.1200, a signal line of 0.1040 and a histogram of +0.0160. The next three bars close at 5.10, 5.16 and 5.24.
| Bar | Close | 12 EMA | 26 EMA | MACD | Signal | Histogram |
|---|---|---|---|---|---|---|
| Start | 5.2000 | 5.0800 | 0.1200 | 0.1040 | +0.0160 | |
| 1 | 5.10 | 5.1846 | 5.0815 | 0.1031 | 0.1038 | -0.0007 |
| 2 | 5.16 | 5.1808 | 5.0873 | 0.0935 | 0.1018 | -0.0082 |
| 3 | 5.24 | 5.1899 | 5.0986 | 0.0913 | 0.0997 | -0.0084 |
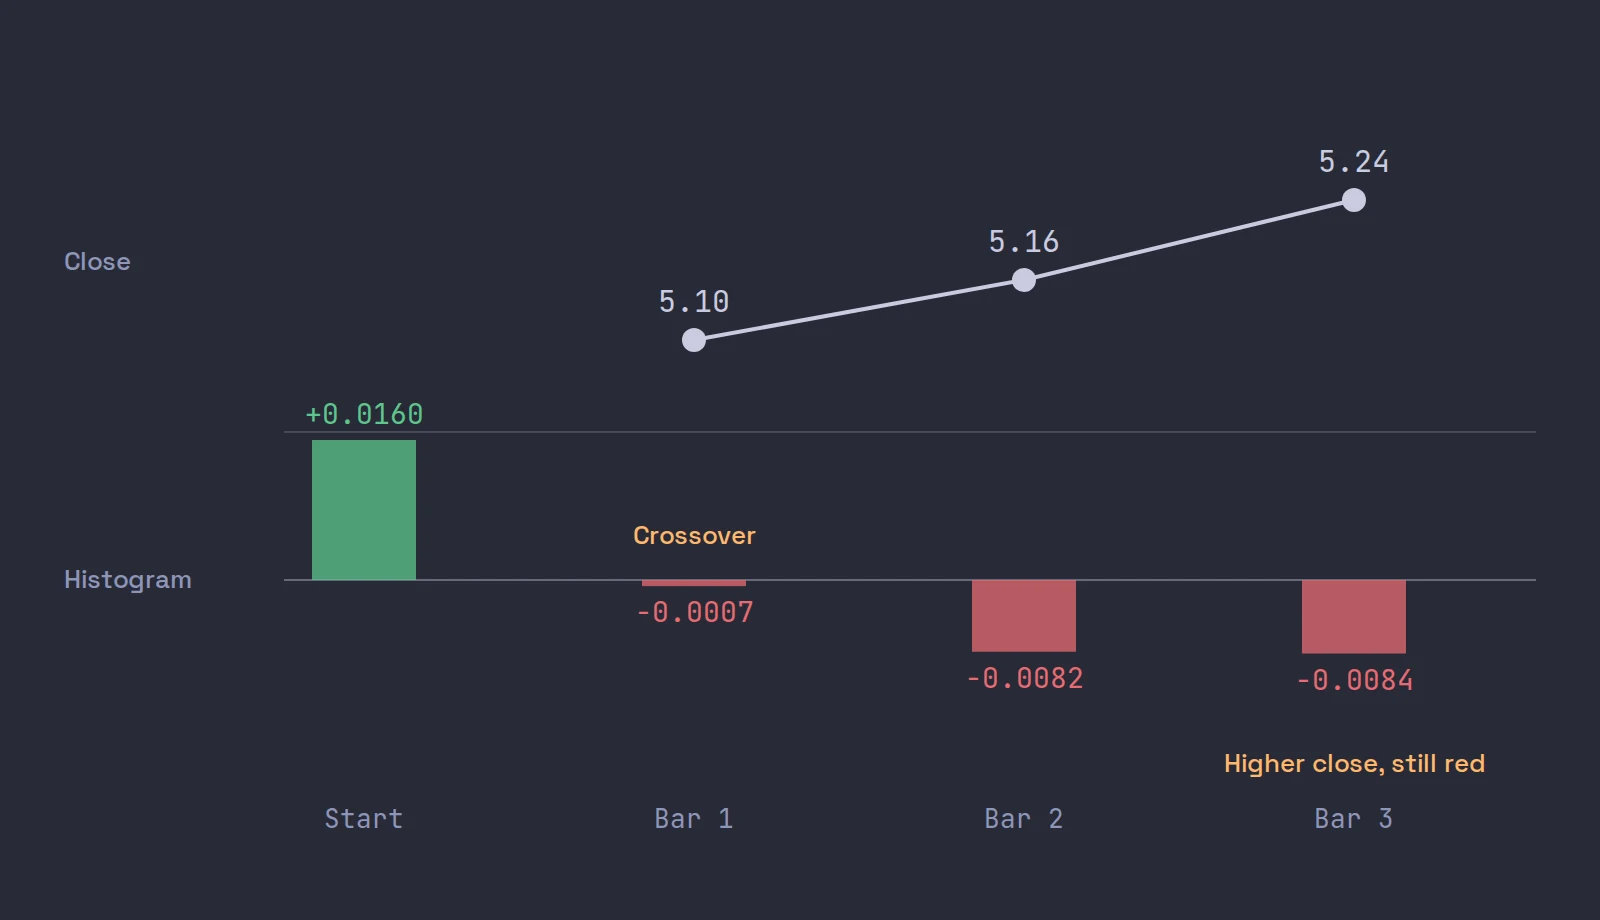
Bar 1: the 12 EMA is 5.10 x 0.1538 + 5.2000 x 0.8462 = 5.1846; the 26 EMA is 5.10 x 0.0741 + 5.0800 x 0.9259 = 5.0815; MACD is 5.1846 - 5.0815 = 0.1031; the signal is 0.1031 x 0.2 + 0.1040 x 0.8 = 0.1038. The MACD line is now under the signal line: a bearish crossover, from one red candle.
Then look at bar 3. The stock closes at 5.24, its highest close in the table, and MACD is still under its signal line with a negative histogram. A trader who sold the crossover at 5.10 watched the stock go 14 cents higher while the indicator still said "bearish". Nothing was wrong with the math. The crossover described one dip, and the averages need several bars to catch up with what price does next.
MACD settings for day trading
The defaults are 12, 26 and 9, and our view is to keep them. Here is what they mean in time, using the average age of an EMA's weights, (1 - k) / k:
| Average | Average age of its weights | On a 1-minute chart | On a 5-minute chart |
|---|---|---|---|
| 12 EMA | 5.5 bars | 5.5 minutes | 27.5 minutes |
| 26 EMA | 12.5 bars | 12.5 minutes | 62.5 minutes |
| 9 EMA signal (of MACD) | 4 bars on top | 4 more minutes | 20 more minutes |
So on a 1-minute chart, the MACD line describes roughly the last quarter of an hour, and the signal line adds another few minutes of delay on top. Faster settings, such as halving every number, make the line react sooner and cross far more often, which mostly means more false crossovers in chop. Slower settings lag more. We know of no study showing that any particular intraday MACD setting is better, and changing the numbers until a backtest looks good is exactly the data snooping problem the research below warns about.
Two settings questions matter more than the lengths:
- Which timeframe. MACD on a 10-second chart is mostly noise. On 1-minute it describes the current push; on 5-minute it describes the morning's trend. Many traders use the 5-minute MACD as the filter for 1-minute entries.
- Pre-market bars or not. On a gapper, MACD computed with pre-market bars and MACD computed from 09:30 can disagree for the first half hour, because the EMAs start from different places.
How to read MACD
| What you see | What it describes |
|---|---|
| MACD above zero | The 12 EMA is above the 26: a short-term uptrend |
| Histogram above zero and growing | The uptrend is speeding up |
| Histogram above zero but shrinking | Still up, but slowing: often the first sign a push is tiring |
| MACD crosses below its signal line | The slowdown has lasted long enough to show in the averages |
| MACD crosses below zero | The 12 EMA has fallen under the 26: the short-term trend has turned |
| Price makes a higher high, MACD a lower high | Divergence: the new high came with less speed than the last |
A note on divergence, the most talked-about MACD read. It describes a fact, the latest push was slower, and slower pushes do sometimes come before a top. But in a strong trend, MACD can show divergence for many bars while price keeps climbing, so it is a reason to tighten, not a reason to sell. On a 1-minute chart, divergence is also more often just a pause; the shape of the candles at that level, covered in candlestick patterns for day trading, usually tells you more.
The MACD crossover, and why we use it as a filter
The MACD crossover, buy when the line crosses above the signal and sell when it crosses back, is the most traded MACD rule. The worked example shows its two weaknesses: it reacts to a single bar, and once it has reacted, it takes several bars to undo. In a choppy stock that means many crosses and small losses; in a fast small cap it means the cross arrives after most of the move.
So we treat MACD as a filter on a setup you already have from the price chart:
- Pass, or take less size, when a long setup forms with MACD under its signal line and the histogram still falling. You would be buying while the averages say the move is slowing.
- Allow the trade when the setup forms with the histogram turning up from a pullback. Then MACD agrees with what the candles are doing.
- Tighten an open long when the histogram shrinks for several bars at a level like the high of day, even before any crossover.
The entry, stop and target still come from the price chart: the pullback low, the high of day, VWAP. MACD only votes on whether to take the trade.
What the research says about MACD
- Mixed, market by market. Chong, Ng and Liew tested MACD and RSI rules on the stock indexes of five OECD countries in the Journal of Risk and Financial Management (2014). The MACD(12,26,0) rule, a zero-line crossing, produced significant abnormal returns in Italy's Milan Comit General and Canada's S&P/TSX Composite, not across the board. These are daily index tests, a long way from a 1-minute small cap.
- Intraday rules in general. Marshall, Cahan and Cahan tested 7,846 popular technical trading rules on intraday US equity data and found none profitable once data snooping was taken into account (Journal of Empirical Finance, 2008).
- The whole literature. Park and Irwin's review counted 95 modern studies of technical trading: 56 positive, 20 negative and 19 mixed, with most of them subject to data snooping, rules chosen after the fact, and hard-to-measure risk and costs (Journal of Economic Surveys, 2007).
There is no good evidence that MACD crossovers make money on intraday small-cap charts, and some evidence that simple intraday rules do not. That is why we describe it as momentum context. Our pillar on the best chart setup for day trading puts MACD in its place among the other layers.
How to add MACD in TWS
In a TWS chart, open Edit > Chart Parameters, go to the Studies tab, and add MACD from Momentum Studies. You can change the period lengths when you create the study, and IBKR notes the averages can be simple, weighted or exponential; for the standard MACD, use exponential with 12, 26 and 9. IBKR's own video explains the indicator and how traders read it:
TWS menu names checked on October 22, 2026, against IBKR's own guide.
Where Scalpel fits
Scalpel's chart has a MACD sub-pane at 12, 26, 9: the MACD line in blue, the signal line in orange, and the histogram. It is off by default, so the candles get the whole height; switch on MACD sub-pane in the chart's cog (panel settings). On a small screen, think twice: the pane takes its height from the candles. The 9 and 20 EMAs on the price pane are on by default, and the 9 and 20 EMA post covers how they relate: MACD is, in effect, the gap between two EMAs drawn on its own scale.
The read bar above the chart does not read MACD at all. When we replayed our chart reads over recorded sessions, momentum calls like "continuation likely" did no better than a coin flip, so the read bar states facts (above or below VWAP, EMAs up or down) and raises only two warnings (read line and read bar). Everything on the chart is in chart basics, the term is in the glossary, and our two-minute video shows the chart with the book and tape:
Scalpel is long only, and its stops are app-monitored rather than resting at IBKR, so they only work while Scalpel runs with a live feed. Scalpel is independent and not affiliated with or endorsed by Interactive Brokers.
Trading carries a significant risk of loss. Nothing here is financial advice.
Questions
- What are the best MACD settings for day trading?
- Most day traders keep the defaults, 12, 26 and 9, on 1-minute and 5-minute charts. Faster settings cross more often, which mostly means more false signals; slower ones lag more. No study shows one intraday setting is reliably better.
- What does the MACD histogram show?
- The gap between the MACD line and its 9-period signal line. A growing histogram means the trend is speeding up; a shrinking one means it is slowing, often before any crossover.
- Is the MACD crossover a good signal?
- On its own, no. A crossover can come from a single bar and takes several bars to undo, so it often arrives after the turn. Broad tests of intraday technical rules found none profitable after correcting for data snooping.
- Is MACD a leading or lagging indicator?
- Lagging. It is built from EMAs of closes, and the signal line is an EMA of an EMA. On a 1-minute chart at 12, 26, 9 it describes roughly the last 15 minutes, plus a few minutes of signal line delay.
- How do day traders use MACD?
- Mostly as a filter: skip or size down a long when MACD is below its signal line and falling, allow it when the histogram is turning up, and tighten an open long when the histogram shrinks for several bars at a key level.
Related guides
Guide 3.5The chart: timeframes, VWAP, EMAs, MACD and deltaScalpel's chart on IBKR data, no TradingView subscription: 10s to daily bars, scroll-back history, VWAP from 04:00 ET, EMA 9 and 20, MACD and delta.Guide 2.3Panel settings: Level 2, tape and chartEvery option behind the Level 2 and chart cogs: rows, colouring, dollar values, the tape column, trade bubbles, gridlines and the warning switches.Guide 14.6The momentum method Scalpel is built aroundThe small-cap momentum style Ross Cameron teaches, from stock selection to gap and go and micro pullbacks, mapped to Scalpel's scanner, intel and stops.
Keep reading
- The best chart setup for day trading: timeframes and indicatorsThe best chart setup for day trading: 1 and 5-minute candles, volume, VWAP, the 9 and 20 EMA and key levels, plus what research says about indicators.
- VWAP for day trading: what it is and how traders use itVWAP for day trading explained: the formula with a worked example, why 04:00 and 09:30 anchors differ, how institutions use it, and how traders read it.
- The 9 and 20 EMA for day trading: formula, lag and how to use themThe 9 and 20 EMA for day trading: the formula worked with real numbers, how much each bar counts, how traders use the pair, and what the research found.
Practice in SIM, against the live book.A lifetime license, every update included, with a 7-day refund guarantee.Ask in DiscordGet Scalpel