Whole dollar levels and half dollars: support and resistance
By Scalpel Team. , updated . 8 min read.
In short
Whole dollar levels such as 5.00, and to a lesser degree half dollars such as 5.50, act as support and resistance because orders cluster there: research on stocks and currencies finds trades, limit orders and take-profit orders bunched on round numbers, and stop-loss orders bunched just beyond them. On a small cap that shows up as sellers stacked on the ask at the whole dollar and stops sitting just under it. Treat round numbers as zones where liquidity sits, not lines that hold.
Every small-cap trader learns this the hard way: a stock runs from 4.20 to 4.97, the bid is strong, and it stops dead under 5.00. A few minutes later it breaks through and runs 30 cents in a few seconds. Or it fails, and falls straight through 4.50.
None of that is mystical. Round numbers are where people put orders, and where orders cluster, price behaves differently. This post covers the published research on round-number clustering, what that clustering looks like on Level 2, how traders use whole dollar levels and half dollar levels for entries, stops and targets, and where the evidence stops.
We build a trading cockpit for Interactive Brokers that draws these levels on every chart by default, so we had to decide how much weight they deserve. Here is what we found.
Why whole dollar levels act as support and resistance
The case rests on one well-documented fact: traders do not spread their orders evenly across prices. They pick round ones.
- Prices cluster. Lawrence Harris (1991) found that "stock prices cluster on round fractions", and that clustering "increases with price level and volatility, and decreases with capitalization and transaction frequency" (Review of Financial Studies 4(3)). Small, volatile, thinly traded stocks are where you would expect the most of it.
- It survived decimalization. When US stocks moved to penny ticks in 2001, prices could have spread out evenly. Ikenberry and Weston (2008) found instead "widespread evidence of price clustering at increments of five and ten cents", with the overall magnitude of clustering "double in scale of what is otherwise expected", and argue it reflects "a more fundamental human bias for prominent numbers" (European Financial Management 14(1), doi:10.1111/j.1468-036X.2007.00410.x).
- Buyers and sellers behave differently on each side of a round number. Bhattacharya, Holden and Jacobsen (2012) studied a random sample of more than 100 million US stock trades. They found excess buying one penny below round numbers and excess selling one penny above, with the imbalance "largest adjacent to integers, second-largest adjacent to half-dollars". They estimate that this behavior costs the traders doing it "losses approaching $1 billion per year" (Management Science 58(2), doi:10.1287/mnsc.1110.1364).
- Limit orders cluster too, and clustering costs. Kuo, Lin and Zhao (2015) found that investors on the Taiwan Futures Exchange who placed a larger share of their limit orders at round numbers "suffer greater losses" across their trades (Review of Financial Studies 28(3)).
The most useful study for a day trader looked at the orders themselves. Carol Osler, then at the Federal Reserve Bank of New York, got the first available data on individual stop-loss and take-profit orders at a currency dealer. Her finding: "Take-profit orders cluster particularly strongly at round numbers", while "stop-loss orders cluster strongly just beyond round numbers" (Journal of Finance 58(5), doi:10.1111/1540-6261.00588). She argues that the first explains why trends tend to stall at support and resistance, and the second why they tend to move fast once a level is crossed.
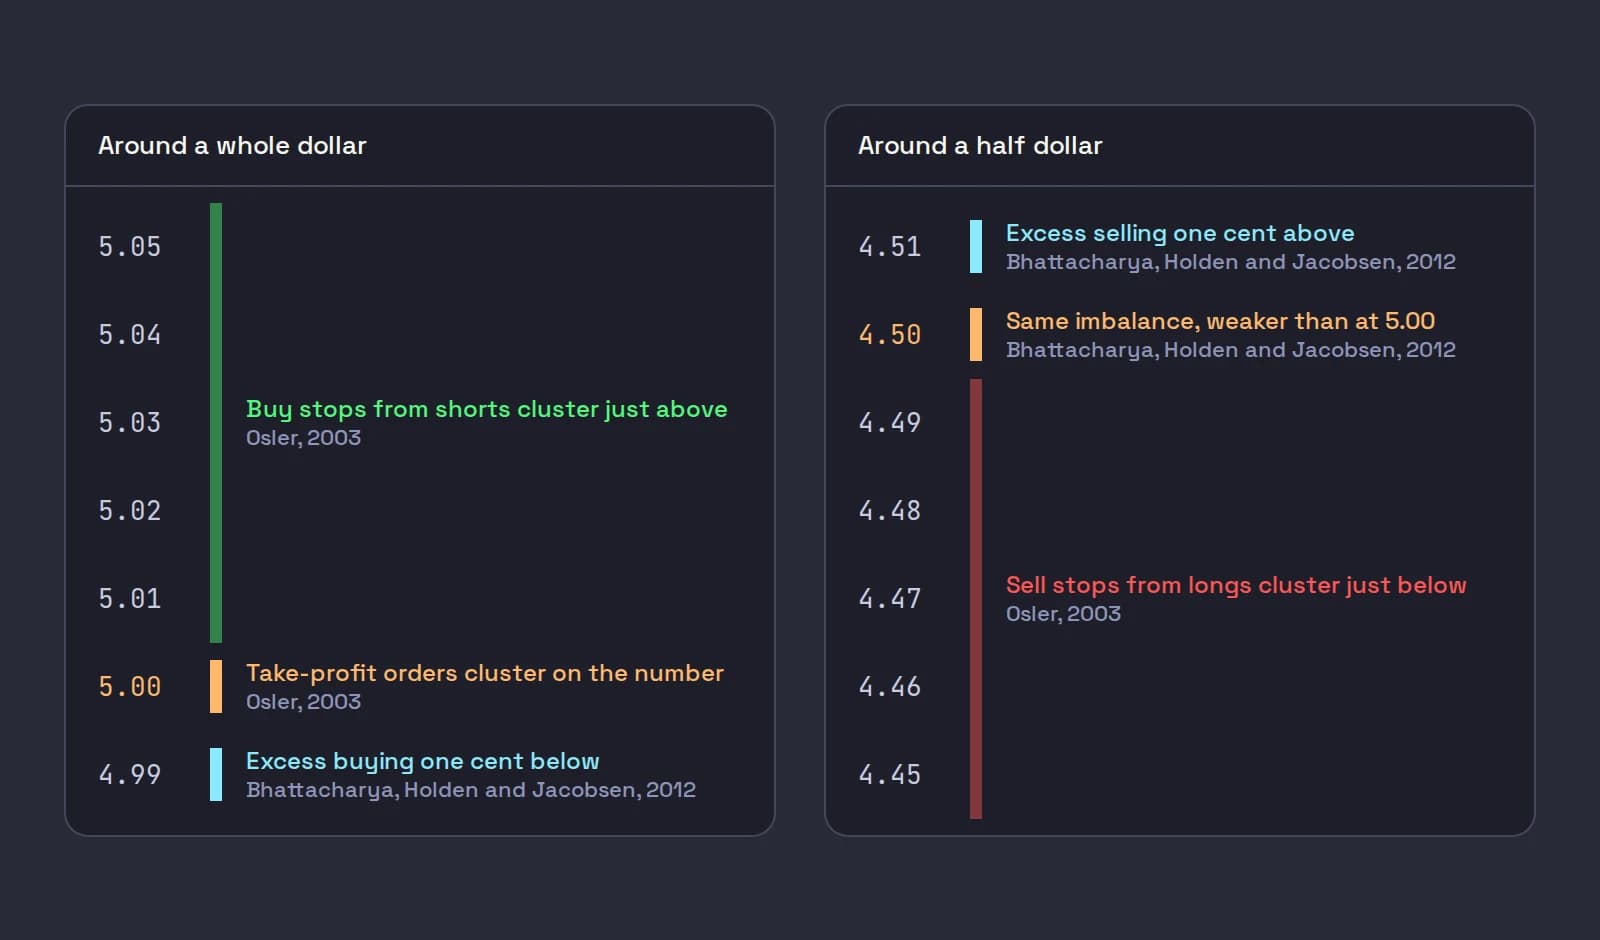
Translate that to a small cap trading at 4.90. Traders who are long have take-profit orders resting at 5.00, which is resistance: sellers waiting on the ask. Short sellers have buy stops just above it, at 5.01 to 5.05. When 5.00 is cleared, those stops become market buys in a hurry, which is why breaks of a whole dollar can be so fast. Below, longs have sell stops just under 4.50 and 4.00, so a break of a half dollar can cascade the same way. A later Osler paper found exchange rate trends "unusually rapid" when rates reached levels where stop-loss orders cluster, with most results significant "for hours, although not for days" (FRBNY Staff Report 150).
What a whole dollar looks like on Level 2
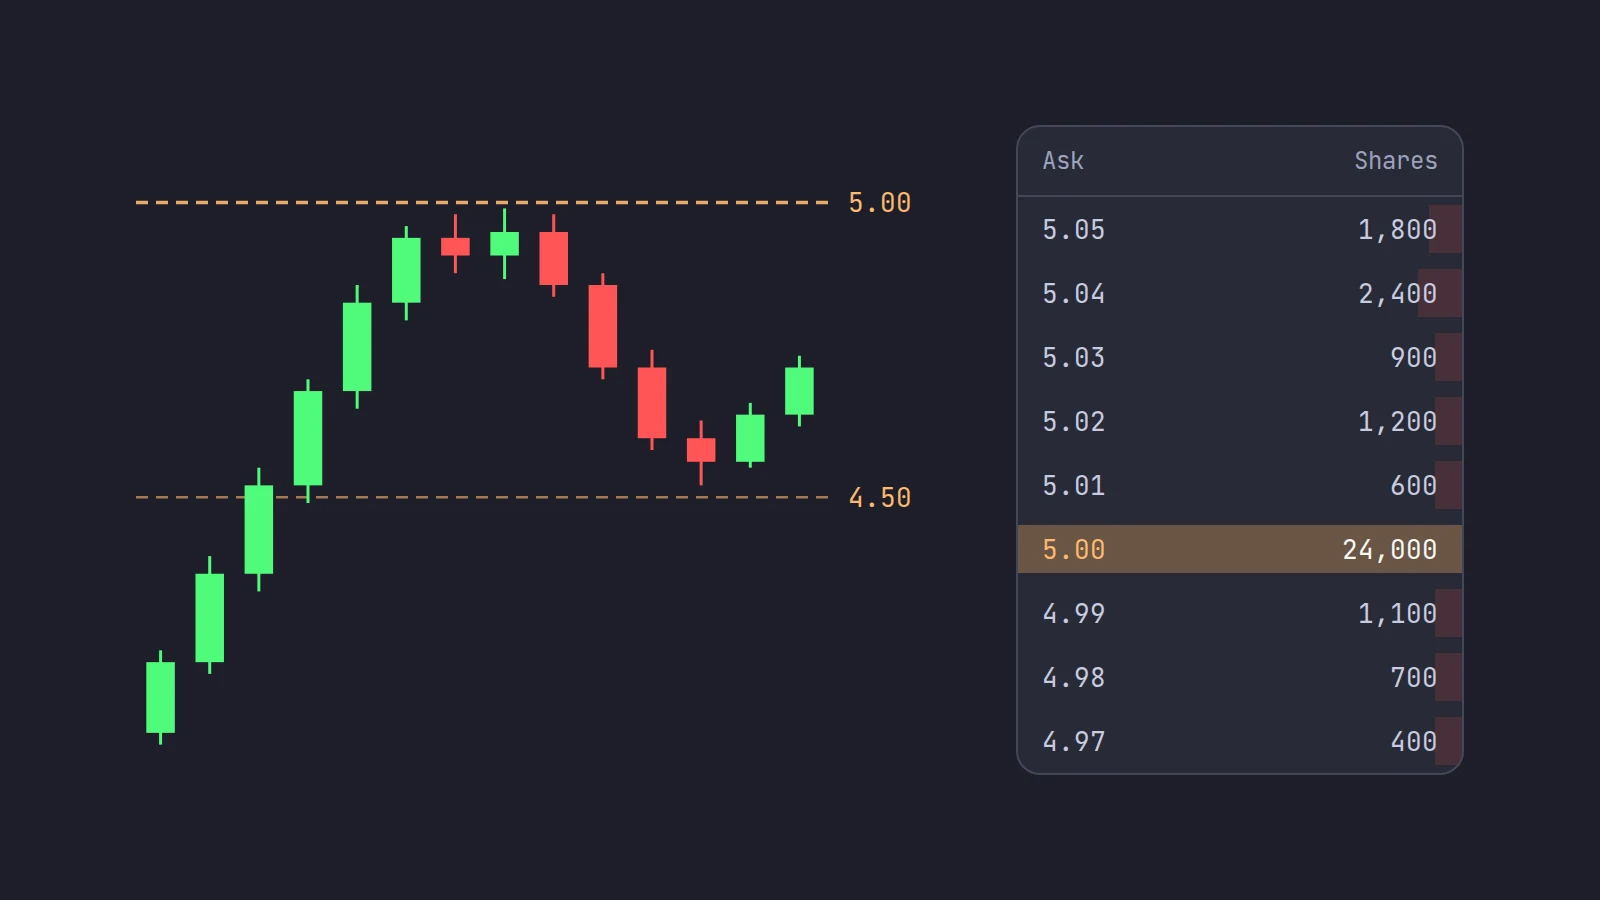
On the book, take-profit clustering looks like a stack of shares offered at exactly 5.00, often across several venues, noticeably larger than what sits at 4.98 and 4.99. It is not always there, and how big it is matters more than whether it exists.
Three things are worth watching as price approaches it:
- Is the size real? A stack that keeps refilling as it trades is a hidden seller, not a one-off offer; Level 2 shows only the displayed part (iceberg orders).
- Is it being taken? Watch the time and sales. Green prints at 5.00, in size, one after another, mean buyers are chewing through it. A stalled tape under a big offer means they are not.
- What happens just after the break? If 5.00 trades through and the bid steps up to 5.00 and 5.01, the old resistance is acting as support. If price pokes to 5.03 and falls back under 5.00, that is a failed break, and the longs who bought it are now the next sellers.
Our post on how to read Level 2 covers the montage itself, and our Level 2 guide how Scalpel shows it.
Half dollar support and resistance
Half dollars matter for the same reason, less strongly. The Bhattacharya, Holden and Jacobsen result is the clearest evidence: the buy-sell imbalance is largest next to whole numbers and second-largest next to half dollars. On a $3 to $8 stock, a 50-cent step is often the natural size of a leg, so 4.50, 5.50 and 6.50 are the levels that matter between the whole dollars.
The tick size rule changes the picture under $1. SEC Rule 612 lets quotes priced under $1.00 go in increments as small as $0.0001, while at $1.00 and above the minimum is $0.01, or $0.005 for stocks whose time-weighted average quoted spread was $0.015 or less (17 CFR 242.612). On a sub-dollar stock quoted at 0.4987, the "round" levels are 0.50 and the dimes, and the book is spread across so many price points that a single level rarely holds the size it would on a $5 stock.
Trading around round numbers: entries, stops and targets
A worked example on a fictional stock. WXYZ gaps up on news and runs in the pre-market from 4.10 to 4.96. The book shows 24,000 shares offered at 5.00. It pulls back to a low of 4.52, holding just above 4.50, then reclaims 4.60 with buyers lifting the ask.
| Decision | Price | Reasoning |
|---|---|---|
| Entry | 4.62 | The reclaim after the pullback held the half dollar |
| Stop | 4.46 | Under 4.50, and a few cents past where stop orders tend to cluster |
| Risk | 0.16 a share | 4.62 - 4.46 |
| Size for $80 risk | 500 shares | 80 / 0.16 |
| First target | 4.97 | Ahead of the 24,000 shares at 5.00 |
| Half off at 4.97 | +$87.50 | 250 x 0.35, which is 2.2R on that half |
| Next level if 5.00 clears | 5.50 | The next half dollar |
The logic of each line:
- Entries. Buying just under a whole dollar with a large seller on it means buying into the most resistance on the chart. Many traders wait for the break of the whole dollar, or for a pullback that holds the half dollar below, as here.
- Stops. A stop at exactly 4.50 or 4.49 sits where everyone else's sits, and Osler's data says that cluster is what drives a fast drop once it triggers. A few cents further away gives the level room to be tested. The trade-off is a wider stop and fewer shares; our post on stop loss placement covers it in more detail.
- Targets. Take-profit orders cluster at the round number, so the queue to sell at 5.00 can be long. A limit at 4.97 or 4.98 can fill while 5.00 is still trading through the queue in front of you.
The same levels work against the pattern traders. A bull flag that breaks out 10 cents under a whole dollar has very little room before it meets the sellers there.
Psychological price levels are zones, not lines
What the evidence supports, and what it does not:
- Clustering is real and well documented, in US stocks before and after decimalization and in currency orders.
- Support and resistance levels have some predictive value, in currency markets at least. Osler's 2000 study of support and resistance levels published by six firms active in the foreign exchange market found "strong evidence that the levels help to predict intraday trend interruptions", but that their predictive power varied across currencies and firms (FRBNY Economic Policy Review 6(2)).
- Nobody has shown that trading round numbers makes money on its own, and the round-number research above mostly shows the opposite: the traders who lean on them most pay for it.
So use psychological price levels to know where the orders are, which helps you place stops and targets. Do not use them as a reason to expect a bounce. The candle and the tape at the level decide it; our post on candlestick patterns for day trading covers what a reversal candle at a level does and does not tell you, and the post on VWAP for day trading the other level most small-cap traders watch.
Where Scalpel fits
Scalpel is a keyboard-first desktop cockpit for your own IBKR account. Its chart draws faint Round-dollar levels by default: half dollars while the visible price range is under $25, and whole dollars up to $200, so the levels are on screen before price gets there (chart basics, panel settings). On Level 2, the grouping stepper merges price levels into wider steps, such as x0.5 or x1, to show how much size sits around a level on a higher-priced stock. The read line flags Hidden seller refilling at the offer when an iceberg keeps refilling the ask, and shows Ask-heavy book: offers tend to cap price in gold when offers outweigh bids near the inside.
Stops and targets are lines on the chart that you drag: put the stop a few cents under the round number, or pull the target just under the whole dollar, and the chip shows the result in dollars and R before you let go (drag stops and targets). Stops are app-monitored, not resting orders at IBKR, so they only work while Scalpel runs with a live feed. In LIVE a stop exit is a sell limit 5 cents under the last trade, re-priced if the market runs away, and no fill is guaranteed.
This video shows the stop and target lines on the chart and how to move them:
For the rest of the chart setup, see the best chart setup for day trading. Scalpel is independent and not affiliated with or endorsed by Interactive Brokers. Sources and the tick size rule checked on October 22, 2026.
Trading carries a significant risk of loss. Nothing here is financial advice.
Questions
- Why do stocks stall at whole dollar levels?
- Because orders cluster there. Research on currency orders found take-profit orders bunched at round numbers, and studies of US stocks found trades and order imbalances concentrated on and around whole and half dollars. Sellers waiting at 5.00 are resistance until they are cleared.
- Are half dollar levels support and resistance?
- To a lesser degree than whole dollars. A study of more than 100 million US stock trades found the buy-sell imbalance largest next to whole numbers and second-largest next to half dollars.
- Should I put my stop loss at a round number?
- Usually not exactly on it. Research on currency orders found stop-loss orders clustered just beyond round numbers, and those clusters can drive fast moves when they trigger. Many traders place the stop a few cents further away and size the position smaller.
- Do round number levels work on stocks under $1?
- Less cleanly. Under $1.00, SEC Rule 612 allows quotes in increments as small as $0.0001, so the book spreads across many more price points and a single level rarely holds the size it would on a $5 stock.
- What are psychological price levels?
- Prices that people pick because they are round, such as 5.00, 10.00 or 4.50. Traders place limit orders, targets and stops at or near them, which is why price often pauses or speeds up there.
Related guides
Guide 3.5The chart: timeframes, VWAP, EMAs, MACD and deltaScalpel's chart on IBKR data, no TradingView subscription: 10s to daily bars, scroll-back history, VWAP from 04:00 ET, EMA 9 and 20, MACD and delta.Guide 3.1How to read Level 2 in ScalpelRead Scalpel's DAS-style Level 2: bids left, asks right, optional colour bands per price, venues, spread, imbalance and delta, and reading players by behaviour.Guide 5.2Move your stop and target on the chartDrag the stop or take-profit line (or its axis tag) on Scalpel's chart, add a target with the + TP handle, reset with a double-click, and know the limits.
Keep reading
- The best chart setup for day trading: timeframes and indicatorsThe best chart setup for day trading: 1 and 5-minute candles, volume, VWAP, the 9 and 20 EMA and key levels, plus what research says about indicators.
- VWAP for day trading: what it is and how traders use itVWAP for day trading explained: the formula with a worked example, why 04:00 and 09:30 anchors differ, how institutions use it, and how traders read it.
- The 9 and 20 EMA for day trading: formula, lag and how to use themThe 9 and 20 EMA for day trading: the formula worked with real numbers, how much each bar counts, how traders use the pair, and what the research found.
Practice in SIM, against the live book.A lifetime license, every update included, with a 7-day refund guarantee.Ask in DiscordGet Scalpel