The 9 and 20 EMA for day trading: formula, lag and how to use them
By Scalpel Team. , updated . 9 min read.
In short
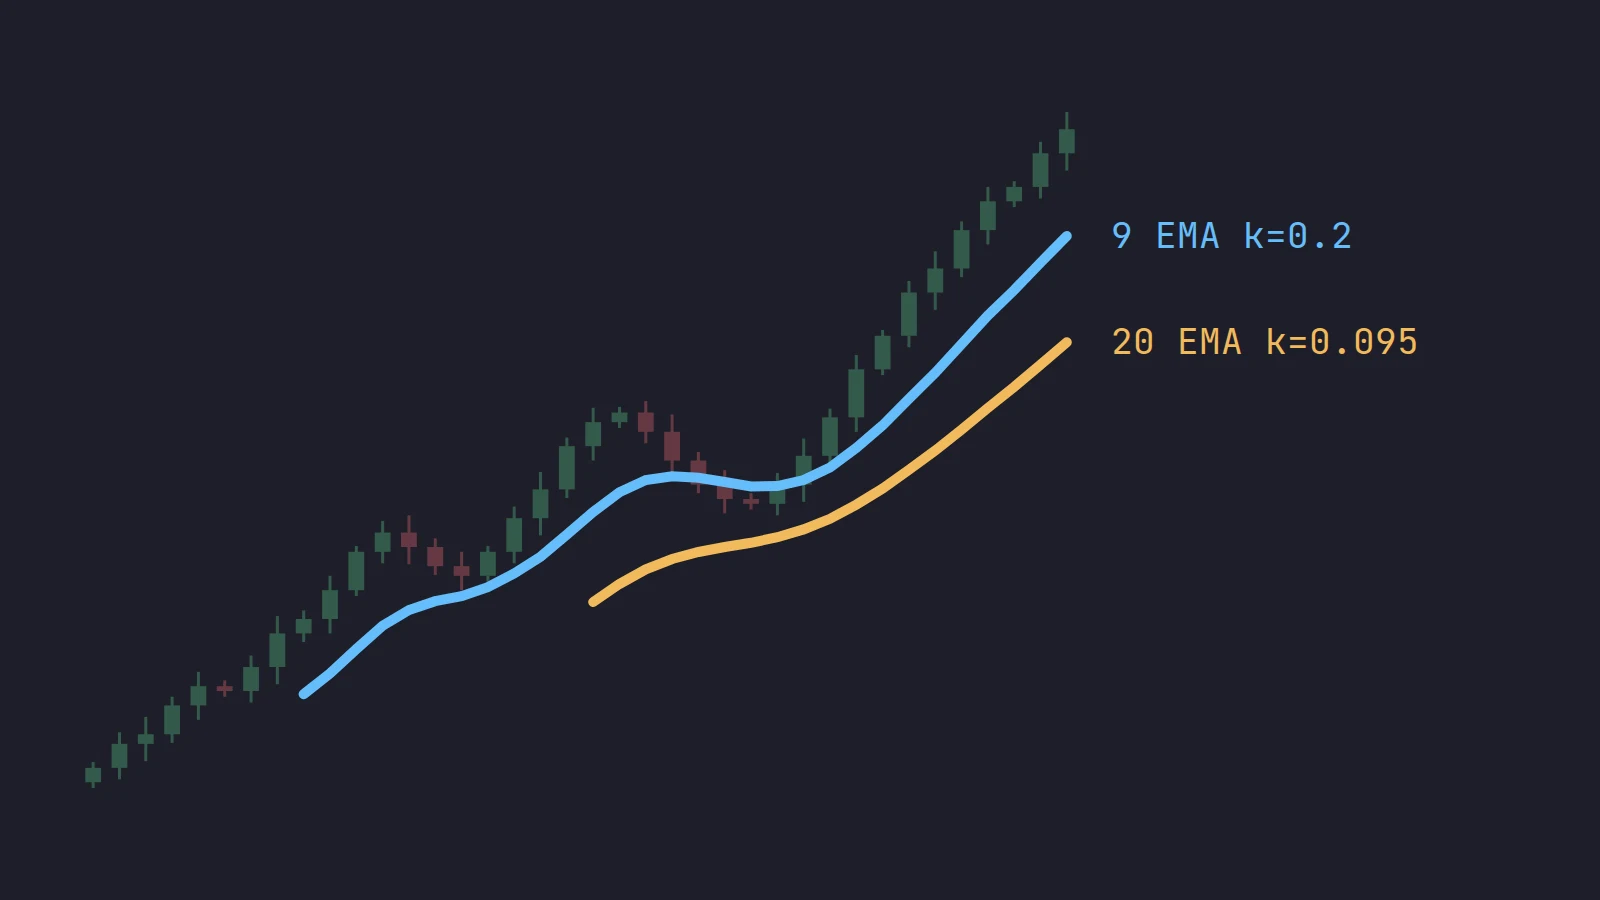
The 9 and 20 EMA are exponential moving averages of the last closes: each new bar moves the line by 2 / (period + 1) of the gap between the close and the old average, so 20% for the 9 EMA and about 9.5% for the 20. In day trading, price riding above a rising 9 EMA with the 9 above the 20 describes a strong short-term trend; a pullback that holds the 9 is shallow, and losing the 20 usually means the push is over. They lag by design and they do not predict: decades of research on moving average rules, including intraday tests, find no reliable profit once data snooping is accounted for.
The 9 and 20 EMA pair is the most common moving average setup on small-cap momentum charts. It is simple, it is on almost every screenshot, and it is often explained as if the lines themselves had some power. They do not. They are two weighted averages of recent closes, one fast and one slow. This post works through the formula with real numbers, shows what 9 and 20 bars mean on 1-minute and 5-minute charts, covers how traders use the pair as a trend filter, and summarizes what the research on moving average rules actually found.
What an EMA is
A simple moving average (SMA) of 9 bars is the plain average of the last 9 closes: each close counts one-ninth, and on the tenth bar the oldest drops off a cliff. An exponential moving average (EMA) weights the newest close most and lets older ones fade gradually, so it turns sooner and never jumps when an old bar leaves the window.
The formula, for a period of N bars:
k = 2 / (N + 1)
EMA now = close x k + EMA before x (1 - k)
For the 9 EMA, k = 2 / 10 = 0.2. For the 20 EMA, k = 2 / 21 = 0.0952. The line needs a starting value: most platforms, ours included, seed it with the simple average of the first N closes and then apply the formula bar by bar. The definition is also in our glossary entry for EMA.
A worked 9 and 20 EMA computation
Say a fictional stock, WXYZ, has a 9 EMA of 5.0000 and a 20 EMA of 4.9500 on its 1-minute chart, and the next four bars close at 5.10, 5.20, 5.05 and 4.98.
| Bar | Close | 9 EMA | 20 EMA |
|---|---|---|---|
| Start | 5.0000 | 4.9500 | |
| 1 | 5.10 | 5.0200 | 4.9643 |
| 2 | 5.20 | 5.0560 | 4.9867 |
| 3 | 5.05 | 5.0548 | 4.9928 |
| 4 | 4.98 | 5.0398 | 4.9915 |
Bar 1, the 9 EMA: 5.10 x 0.2 + 5.0000 x 0.8 = 1.02 + 4.00 = 5.0200. The 20 EMA: 5.10 x 0.0952 + 4.9500 x 0.9048 = 4.9643.
Over the two green bars the 9 EMA rose 5.6 cents and the 20 EMA only 3.7. On bar 3, a red bar that closes above both, the 9 barely moves and the 20 keeps rising: a pullback holding the 9. On bar 4, the close at 4.98 is under both lines. The 9 EMA has turned down, and the stock has given back the push. Nothing in the numbers says what bar 5 will do.
How much each bar counts
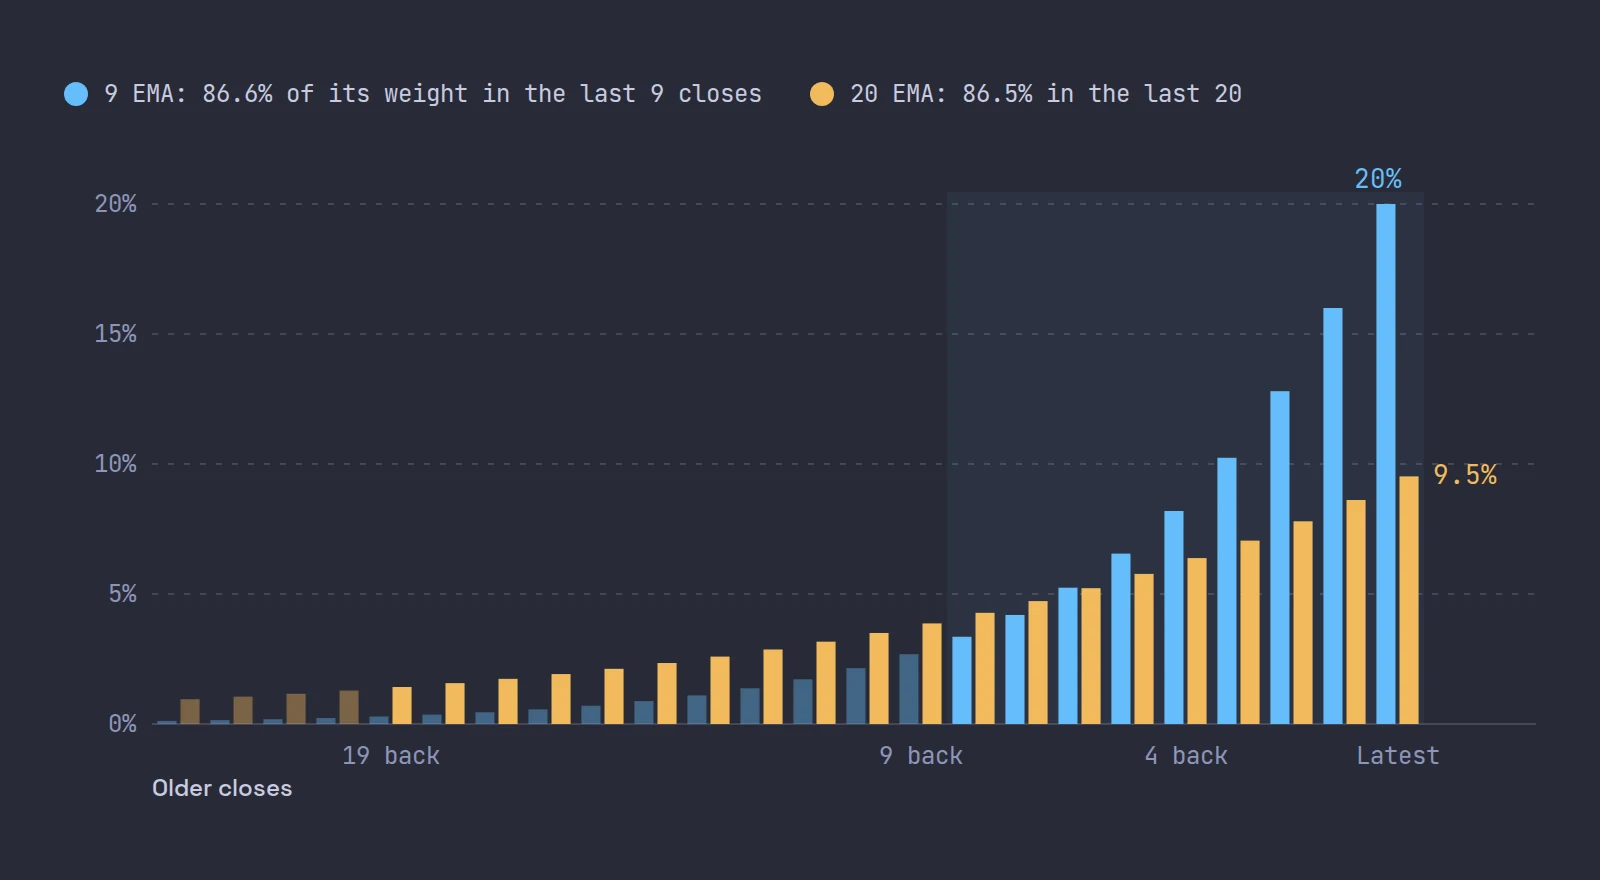
Unroll the formula and each past close gets a weight that shrinks by a factor of (1 - k) per bar:
| 9 EMA | 20 EMA | |
|---|---|---|
| Weight on the latest close | 20.0% | 9.5% |
| Weight on the close before | 16.0% | 8.6% |
| Share of weight in the last N bars | 86.6% | 86.5% |
| Average age of the weights | 4 bars | 9.5 bars |
The last two rows explain both lines. Each EMA puts about 87% of its weight on its last N bars, which is why a 9 EMA behaves roughly like a 9-bar average. And the average age of the weights, (1 - k) / k, is how far behind price the line sits in a steady trend: 4 bars for the 9, 9.5 bars for the 20.
What that means in time depends on the chart:
| Chart | 9 EMA lag | 20 EMA lag |
|---|---|---|
| 10-second | 40 seconds | 95 seconds |
| 1-minute | 4 minutes | 9.5 minutes |
| 5-minute | 20 minutes | 47.5 minutes |
On a small cap that can run 20% in five minutes, a line that is 4 minutes behind is a description of the move you just watched. That is not a flaw, it is what an average is.
Why 9 and 20, and is there a best EMA for day trading?
There is nothing special in 9 and 20. They are conventions: a fast line short enough to hug a strong 1-minute trend and a slow one about twice as long. The 8 and 21 pair, common in other circles, is nearly identical: k = 0.222 for the 8 and 0.091 for the 21, against 0.2 and 0.095.
If anything gives 9 and 20 a role, it is that so many momentum traders watch them, so a pullback to the 9 on a hot stock is where a lot of people look to buy. That is a reason to know where the lines are, not evidence that they work. We know of no study showing that 9 and 20 beat other lengths intraday. Pick a pair, keep it, and learn what it looks like on the stocks you trade.
9 EMA and 20 EMA day trading: how traders use them
Traders use the pair as a trend filter and as a place to look, not as a trigger.
| What you see | What it describes | What traders do with it |
|---|---|---|
| Price above a rising 9, 9 above 20 | A strong short-term trend | Look for longs only; pullbacks toward the 9 are the entries |
| Pullback holds the 9 and the next candle makes a new high | Buyers stepped in early; the pullback was shallow | Some buy the first candle to make a new high, stop under the pullback low |
| Pullback loses the 9 but holds the 20 | A deeper pullback | Smaller size, or wait for the 9 to be reclaimed |
| Close under the 20, 9 turning down | The push has stalled or failed | Longs exit or tighten; no new longs |
| 9 and 20 flat and tangled | No trend | Sit out: every cross is noise |
The second row is the shape of a bull flag and of the first pullback strategy: the EMA is just a visual guide to how deep the pullback went. The stop goes under the pullback low, a real price, not under the EMA, which moves.
A 9/20 crossover strategy (buy when the 9 crosses above the 20, sell when it crosses back) is the version most often backtested, and the lag table above shows its weakness: on a 1-minute chart, the cross comes minutes after the turn. On a fast stock that is most of the move.
Use two timeframes. A 1-minute chart with the 9 above the 20 inside a 5-minute chart that is still below its own 20 is a bounce in a downtrend, not a trend. Many traders only take 1-minute pullback entries when the 5-minute 9 and 20 point the same way. Add VWAP and you have the standard three-line read: above VWAP, 9 over 20, both rising.
What the research says about moving average rules
Moving average rules are some of the most tested ideas in finance.
- The famous positive result. Brock, Lakonishok and LeBaron tested moving average and trading range break rules on the Dow Jones index from 1897 to 1986 and reported "strong support for the technical strategies", with buy signals followed by higher returns than sell signals (Journal of Finance, 1992).
- The data snooping correction. Sullivan, Timmermann and White took Brock and colleagues' 26 rules, expanded them into a much larger universe and applied them to 100 years of daily Dow data, using a bootstrap test designed to measure how much searching through many rules inflates the best one's apparent performance (Journal of Finance, 1999).
- Intraday. Marshall, Cahan and Cahan tested 7,846 popular technical rules, moving average rules among them, on intraday US equity data: none was profitable once data snooping was taken into account (Journal of Empirical Finance, 2008).
- Small caps. Shynkevich tested technical rules on small-cap and technology portfolios from 1995 to 2010. Some predictability showed up in the first half; in the second half, no rule beat buy and hold for any portfolio (Journal of Banking and Finance, 2012).
Read together: the more carefully moving average rules are tested, and the shorter the horizon, the less is left. That fits how we use EMAs, as a fast way to see the trend and the depth of a pullback, while the trade's risk is set by real prices on the chart. Our pillar on the best chart setup for day trading covers the rest of the evidence.
How to add the 9 and 20 EMA in TWS
Open the chart parameters
On a TWS chart, open Edit > Chart Parameters and go to the Studies tab.
Add the 9 EMA
Expand Moving Averages on the left, choose the exponential moving average, click Add, and set the period to 9 on closes.
Add the 20 EMA
Repeat with a period of 20, and give the two lines colors you can tell apart at a glance.
Decide on extended hours
In the chart time options on the Chart Parameters tab, choose whether to show data outside regular trading hours. With pre-market bars included, the EMAs at 09:30 already reflect the morning; without them, the lines carry over from the prior afternoon.
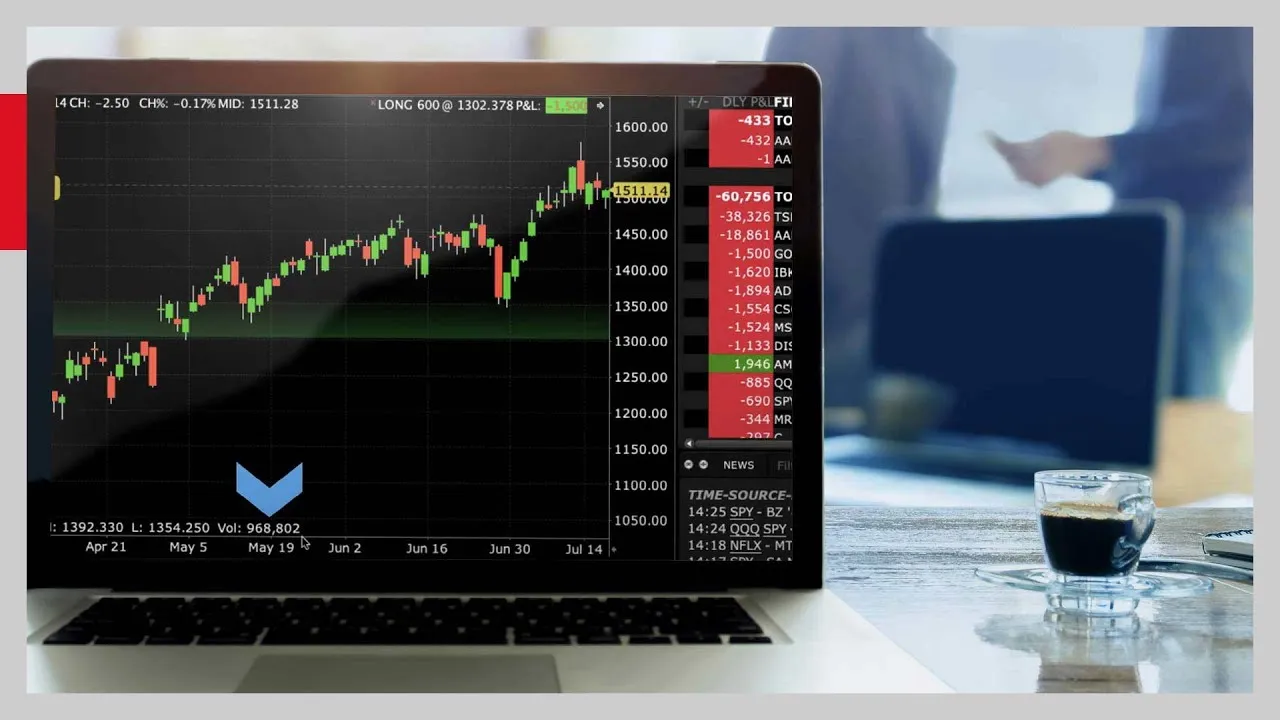
The menu paths are from IBKR's guide to short-term indicators in TWS, checked on October 22, 2026. IBKR's chart lesson shows the Chart Parameters panel and the Studies tab on screen:
That last step matters more than it looks. On a gapper, a 1-minute 9 EMA computed with pre-market bars starts the session near the pre-market price; one computed without them starts near yesterday's close, possibly 40% lower, and spends the first minutes catching up. Two traders looking at "the 9 EMA" at 09:32 can be looking at very different lines.
The limits of EMAs
- They lag. By construction, as the tables show. Expect every cross after the turn.
- They chop. In a sideways stock the lines tangle and every cross is a small loss.
- Gaps break them. After a halt or a gap, the EMA needs several bars to catch up, and for those bars it means little.
- They know nothing about volume. A pullback to the 9 on heavy selling and one on light volume look the same to the line. Volume and MACD answer different questions.
Where Scalpel fits
Scalpel's chart draws the 9 EMA in blue and the 20 in orange on every desk, on by default, from 10-second to daily candles. They are seeded with a simple average and computed with the k = 2 / (N + 1) formula above, so the numbers you work out by hand match the lines. The lengths are not in the chart cog; they can only be changed in Scalpel's settings file (chart basics, panel settings).
The read bar above the chart puts the EMA fact in words, EMAs up when the 9 is at or above the 20 and EMAs down otherwise, next to Above VWAP or Below VWAP, so you do not have to squint at two lines in a fast move (read line and read bar). It is a description, not a signal. How these lines fit into the small-cap routine is in the momentum method guide, and our two-minute video shows the chart with the book and tape:
Scalpel is long only, and its stops are app-monitored rather than resting at IBKR, so they only work while Scalpel runs with a live feed. Scalpel is independent and not affiliated with or endorsed by Interactive Brokers.
Trading carries a significant risk of loss. Nothing here is financial advice.
Questions
- What is the 9 and 20 EMA strategy?
- Traders look for longs when price is above a rising 9 EMA and the 9 is above the 20, and buy pullbacks that hold the 9, with the stop under the pullback low. A close under the 20 usually means the push is over. It describes the trend; it does not predict it.
- What is the best EMA for day trading?
- There is no best length. The 9 and 20 are conventions that many momentum traders watch on 1-minute and 5-minute charts; the 8 and 21 behave almost the same. No study we know of shows one pair beating another intraday.
- How do you calculate a 9 EMA?
- Use k = 2 / (9 + 1) = 0.2. Each new value is the close times 0.2 plus the previous EMA times 0.8. Seed the line with the simple average of the first 9 closes.
- Is the EMA better than the SMA for day trading?
- The EMA weights recent closes more, so it turns sooner and does not jump when an old bar drops out. That suits fast intraday charts, but it still lags: a 9 EMA sits about 4 bars behind price in a steady trend.
- Do moving average crossovers work?
- The evidence is weak. Early studies on a century of Dow data looked positive, but later tests that corrected for data snooping, including a test of 7,846 intraday rules, found no reliable profit. Crossovers also come after the turn by construction.
Related guides
Guide 3.5The chart: timeframes, VWAP, EMAs, MACD and deltaScalpel's chart on IBKR data, no TradingView subscription: 10s to daily bars, scroll-back history, VWAP from 04:00 ET, EMA 9 and 20, MACD and delta.Guide 2.3Panel settings: Level 2, tape and chartEvery option behind the Level 2 and chart cogs: rows, colouring, dollar values, the tape column, trade bubbles, gridlines and the warning switches.Guide 14.6The momentum method Scalpel is built aroundThe small-cap momentum style Ross Cameron teaches, from stock selection to gap and go and micro pullbacks, mapped to Scalpel's scanner, intel and stops.
Keep reading
- The best chart setup for day trading: timeframes and indicatorsThe best chart setup for day trading: 1 and 5-minute candles, volume, VWAP, the 9 and 20 EMA and key levels, plus what research says about indicators.
- VWAP for day trading: what it is and how traders use itVWAP for day trading explained: the formula with a worked example, why 04:00 and 09:30 anchors differ, how institutions use it, and how traders read it.
- MACD for day trading: settings and how to read itMACD for day trading: what 12, 26, 9 measures, a worked crossover example, why it lags, and how to use MACD as a filter instead of a buy signal.
Practice in SIM, against the live book.A lifetime license, every update included, with a 7-day refund guarantee.Ask in DiscordGet Scalpel