Bull flag pattern: how to trade it in small caps
By Scalpel Team. , updated . 9 min read.
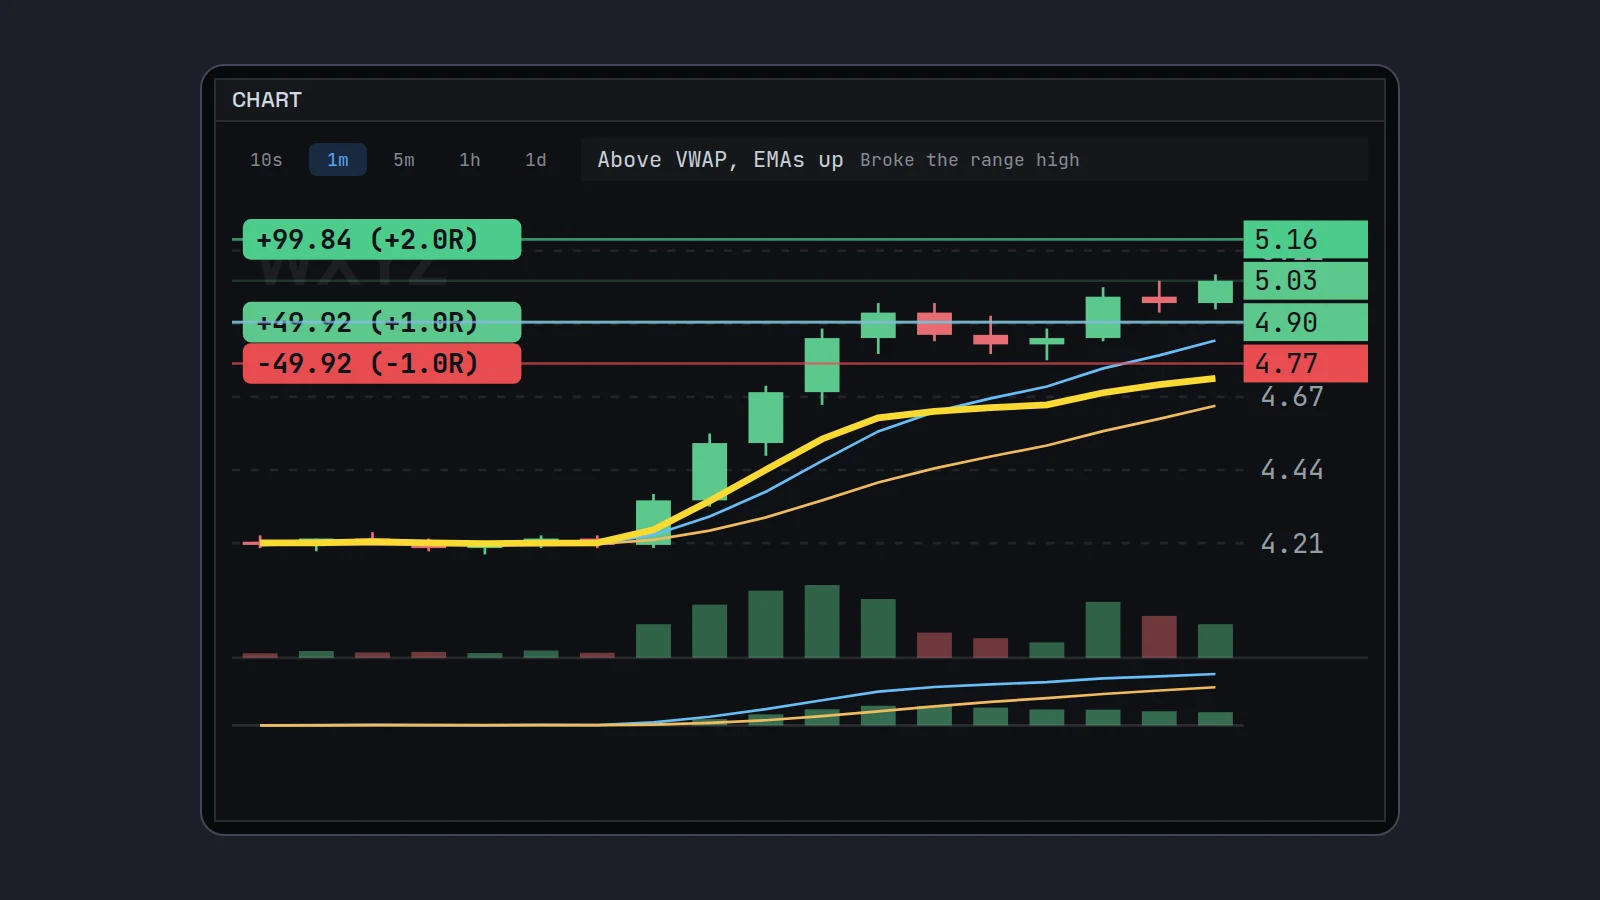
In short
A bull flag pattern is a sharp move up (the pole), then a short, tight pullback on lighter volume (the flag), then a break above the flag's high. Traders who use it buy the break, put the stop just under the flag's low, and aim for at least twice the risk. The evidence is modest: on daily charts Thomas Bulkowski found that 44% of flags failed to rise even 5% after an upward breakout, so treat a bull flag as a place to define risk, not a prediction.
The bull flag is the most common continuation pattern in small-cap momentum trading. A stock squeezes up on news, pauses for two or three candles, and either breaks out again or rolls over. This post covers what a valid bull flag looks like on a 1-minute chart, how to trade it with an entry, a stop and a target you can write down in advance, a fully worked example, and what the published evidence actually says about it.
We build a trading cockpit for Interactive Brokers that detects this pattern on its scanner, so we have looked at a lot of them. Our view: the flag itself is easy to spot. The hard part is the context around it, and that is where most of this post goes.
What a bull flag pattern looks like
A bull flag has three parts, and each one has a job.
| Part | What you see | What it tells you |
|---|---|---|
| The pole | Three to six strong green candles, often on several times normal volume | Buyers are in control and willing to pay up |
| The flag | One to a few small candles drifting sideways or slightly down | Early buyers take some profit, but nobody is dumping |
| The break | A candle that trades above the flag's high, with volume picking up | Buyers are back, and the pullback is over |
Bulkowski, who has catalogued chart patterns for decades, describes flags as small rectangles "usually tilted against the prevailing price trend" and says that without a straight-line move up, "you don't have a flag" (Bulkowski on flags). He also notes that volume trended down during the flag in 74% of the cases with upward breakouts. That fits the intuition: a healthy pause is quiet.
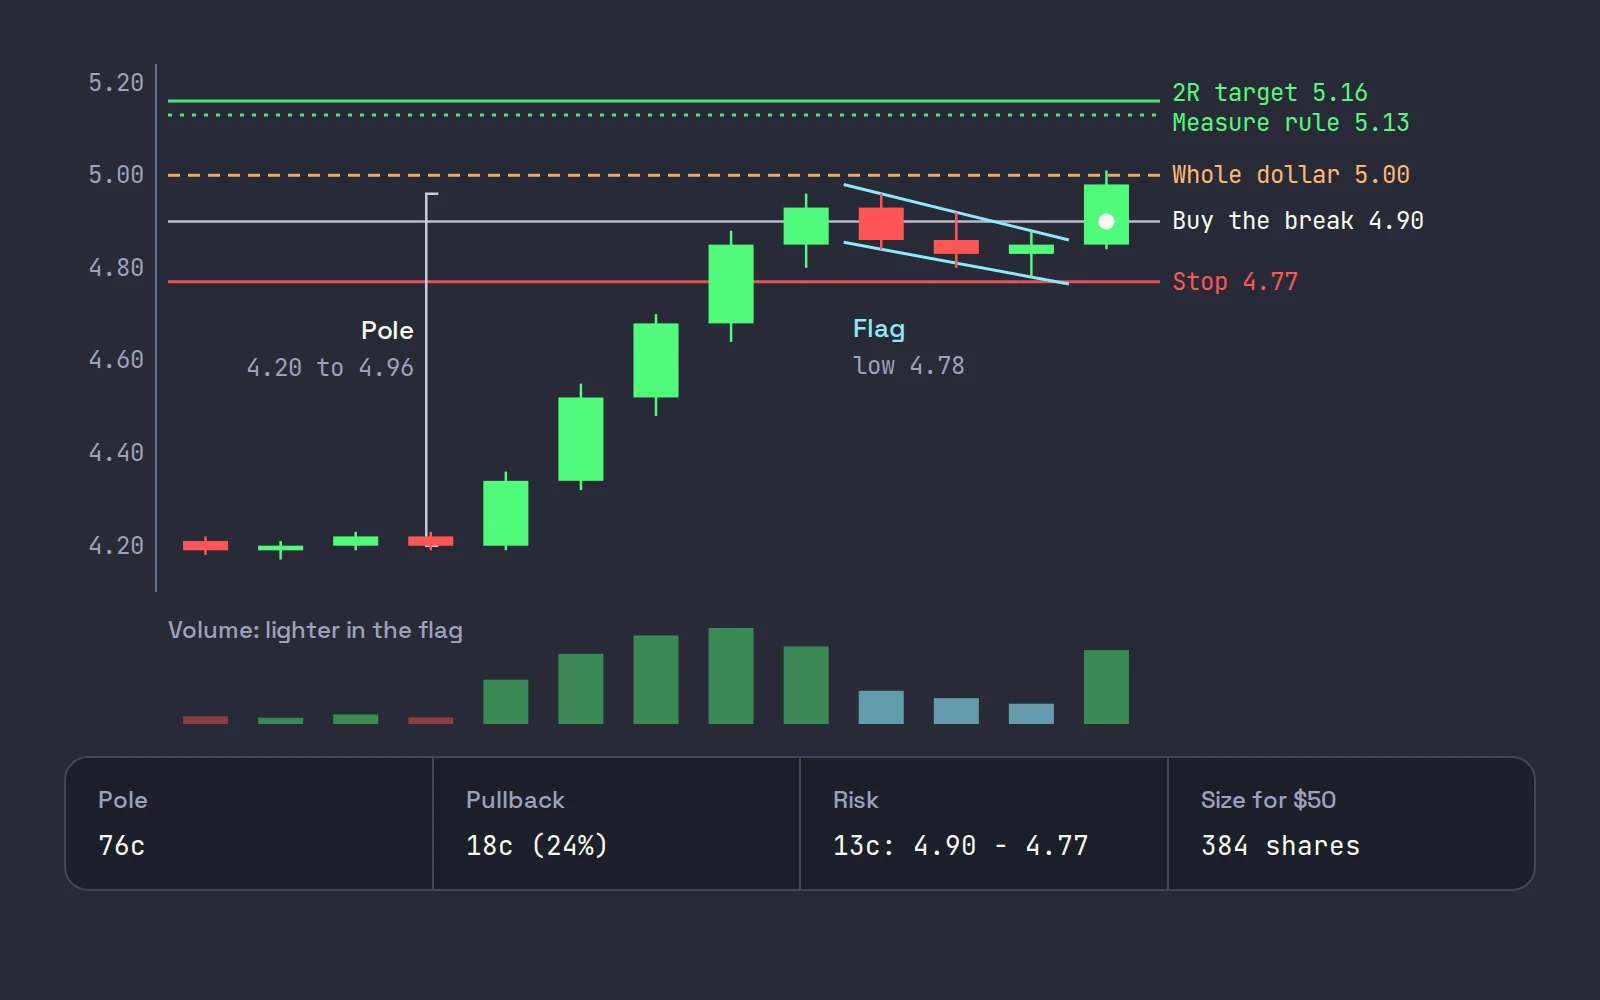
Two rules of thumb separate a flag from a reversal:
- The pullback stays shallow. Many momentum traders want the flag to give back less than half of the pole. Scalpel's own detector uses exactly that line: one to three tight candles that drift by no more than half the pole (scan types). A flag that gives back 70% of the pole is not a pause; it is the move failing.
- The flag stays above the levels that matter. Above VWAP and holding the 9 EMA is the usual standard. A flag that pulls back under VWAP has changed character, which our post on VWAP for day trading covers in detail.
Bull flag trading: entry, stop and target
Here is the plan most traders use, written as rules you can test in a simulator.
Entry. Buy when price trades above the high of the flag, usually the high of the last flag candle or a trendline drawn across the flag's highs. Use a marketable limit: the ask plus a few cents, so you get filled in a fast break without paying any price. Buying inside the flag, before the break, gets a better price but more failures; buying well above the break means chasing.
Stop. Just under the flag's low. If price comes back through the low of the pause, the pattern has failed by its own definition and there is no reason to stay. A cent or two under the low is less likely to be tagged by a single wick than the low itself.
Size. Size from the stop, not from a share count. Decide the dollars you will lose if the stop is hit, divide by the distance from entry to stop, and round down.
Target. Two common choices: the high of the pole (a retest), or a fixed multiple of your risk, such as 2R. Bulkowski's measure rule is a third: take the height of the pole, multiply it by the share of flags that met their target in his data (46%), and add the result to the flag's low.
A worked example on WXYZ
WXYZ, a fictional $4 stock, prints a news headline at 08:12 ET. On the 1-minute chart:
- Pole: five green candles take it from 4.20 to a high of 4.96, on rising volume. That is a 76-cent pole.
- Flag: three small candles with highs of 4.96, 4.92 and 4.88, and a lowest low of 4.78. The pullback is 18 cents, about 24% of the pole, well under half. Volume on the three candles is less than half of the pole's average. Price stays above VWAP at 4.55.
- Break: the next candle trades through 4.88. You buy with a limit at the ask plus 3 cents and fill at 4.90.
Now the numbers:
| Item | Price | Arithmetic |
|---|---|---|
| Entry | 4.90 | Filled on the break of 4.88 |
| Stop | 4.77 | One cent under the flag low of 4.78 |
| Risk per share | 0.13 | 4.90 - 4.77 |
| Shares for $50 risk | 384 | 50 / 0.13 = 384.6, rounded down |
| 2R target | 5.16 | 4.90 + 2 x 0.13 |
| Measure rule target | 5.13 | 0.76 x 0.46 = 0.35, added to 4.78 |
| Pole high | 4.96 | First place sellers showed up |
Look at what sits between the entry and both targets: 5.00, a whole dollar. Sellers tend to stack offers at round numbers, so even a perfect flag can stall there. Many traders take part of the position just under 5.00 and hold the rest for a clean break. Our post on whole and half dollar levels covers why that level matters and what the research says about it.
Bull flag day trading: where it fails
Most bull flags that fail do so for a reason you could see before you bought. These are the ones we would check first.
- No volume on the break. A break of the flag high on a trickle of shares is often a few small buyers testing, not a return of demand. Watch the tape: you want to see buyers taking the ask in size, not single 100-share prints.
- A seller sitting on the ask. If a large offer sits at the breakout price or just above it, buyers have to chew through it first. Level 2 shows you how big it is (how to read Level 2).
- The flag is too deep or too long. A pullback of more than half the pole, or a flag that drags on for ten or more 1-minute candles, means the buyers who made the pole have left.
- It is the third or fourth flag of the day. Each new leg brings in fewer new buyers and more people looking to sell. The first pullback after a strong move tends to be the cleanest (first pullback strategy).
- The company can sell stock into the move. A small cap with an active shelf registration or an at-the-market program can sell shares into every rally, which caps flags from above.
- The break fails and closes back inside. A candle that pokes above the flag high and then closes back under it is a classic false breakout. Scalpel's chart calls this a bull trap; in replays over recorded sessions, price tended to dip over the next 30 to 60 seconds (read line and read bar).
What the evidence says about bull flags
Chart patterns describe what price did. They do not tell you what it will do next, and the published evidence on flags is thinner than their popularity suggests.
Bulkowski's daily chart statistics. His flags page reports, for bull markets, a break-even failure rate of 44% for upward breakouts, an average rise of 9%, and 46% of flags reaching the measure rule target (thepatternsite.com: flags, statistics updated on August 27, 2020). His glossary defines the break-even failure rate as the share of patterns that fail to rise at least 5% after the breakout, "the percentage of patterns that fail to cover the cost of trading" (glossary). These are daily charts with flags lasting days to under three weeks, not 1-minute flags in a small cap. They tell you a flag is roughly a coin flip with a modest edge on daily charts, not that it works intraday.
An intraday test on an index. Cervello-Royo, Guijarro and Michniuk (2015) built a trading rule around a formal flag definition, with fixed profit targets and stop losses, and tested it on 91,307 intraday observations of the Dow Jones index across 96 parameter settings (Expert Systems with Applications 42(14), doi:10.1016/j.eswa.2015.03.017). They report positive results, larger on the German and British indexes than on the Dow. An index is not a $4 small cap with a 3-cent spread, and a rule tuned over 96 settings needs out-of-sample proof before anyone should trust it.
The broader caution. Marshall, Cahan and Cahan (2008) tested 7,846 popular technical trading rules on intraday US equity data and found that none were profitable once data snooping was accounted for (Journal of Empirical Finance 15(2)). Flags were not part of that study, but it is a fair warning about any pattern that looks good on a hand-picked chart.
Our reading: the bull flag gives you a clear invalidation point (the flag low) and a reason to expect buyers at the break. That makes it a useful way to structure a trade with defined risk. It is not evidence that the trade will work, and nothing here suggests it makes money on its own.
How to practice it in TWS
You can trade this pattern with Trader Workstation alone:
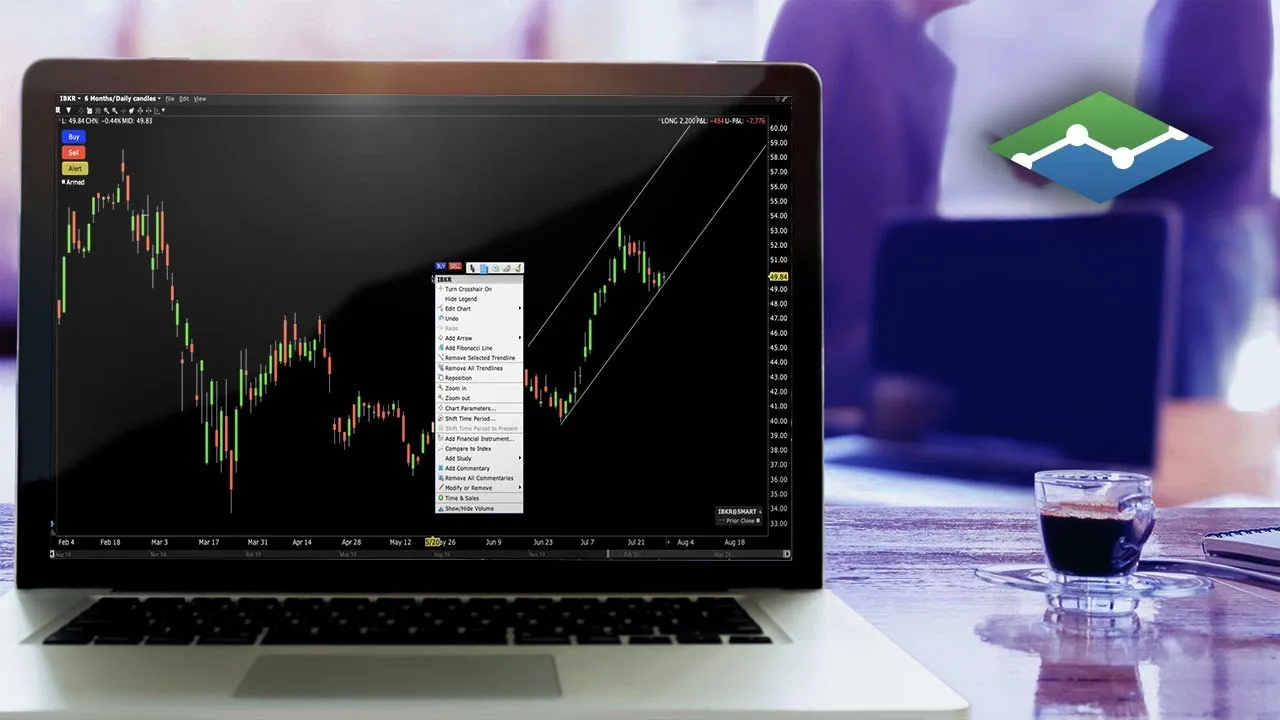
- Open a chart and set it to 1-minute bars: click Edit at the top of the chart window, then Chart Parameters, and choose the time period and bar size (IBKR: chart parameters). Many traders time the entry on a second, faster chart; see the best timeframe for scalping.
- Add VWAP and the 9 and 20 EMAs, and draw a line across the flag's highs.
- Use a paper trading login and write down the entry, stop, size and target before each trade.
For step 2, IBKR's short lesson shows how to add, move and remove lines on a TWS chart, which is all you need to mark a flag's highs and lows.
IBKR's Traders' Academy has a short lesson on trend and continuation patterns, built from CME Group's study notes, that covers flags and pennants as a general concept. Keep a log of every flag you take: break time, volume, depth of the pullback, distance to the next whole dollar, and the result in R. After 50 trades you will know more about your version of the pattern than any statistic in this post.
Where Scalpel fits
Scalpel is a keyboard-first desktop cockpit for your own IBKR account. Its Setups scan watches every stock on the IBKR scanner's list on 1-minute candles and marks a live bull flag with a light green F chip and a "Bull flag" callout (scan types). It also detects the micro pullback, the flat top breakout and gap and go, which share the same logic of a pause and a break (momentum method).
A chip says the pattern is there, not that it will work: the detectors are deliberately simple, and a flag on a stock with no news means much less. When you take the trade, the Risk (Low) preset puts the stop just under the lowest low of the last 20 one-minute candles and sizes the order from that distance, which suits a pullback entry (sizing presets). The stop and target then show on the chart, where you can drag them under the flag low or up to the pole high (how stops work). Stops are app-monitored, not resting orders at IBKR, so they only work while Scalpel runs with a live feed.
This short video shows the chart, the read bar and the Level 2 reads that sit around a pattern like this:
For the full chart setup behind this post, see the best chart setup for day trading. Scalpel is independent and not affiliated with or endorsed by Interactive Brokers or Thomas Bulkowski. Sources checked on October 22, 2026.
Trading carries a significant risk of loss. Nothing here is financial advice.
Questions
- What is a bull flag pattern?
- A sharp move up (the pole), followed by a short, tight pullback or sideways drift on lighter volume (the flag), then a break above the flag's high. Traders read it as a pause in an uptrend rather than a reversal.
- Where do you put the stop on a bull flag?
- Just under the low of the flag. If price comes back through the low of the pause, the pattern has failed by its own definition. A cent or two under the low is less likely to be hit by a single wick.
- How reliable is the bull flag pattern?
- Less than its reputation. On daily charts in bull markets, Thomas Bulkowski found that 44% of flags with upward breakouts failed to rise at least 5%. There is no solid published evidence that 1-minute bull flags in small caps are profitable on their own.
- What timeframe is best for bull flags in day trading?
- Small-cap momentum traders usually read bull flags on the 1-minute chart, and some time the entry on a 10-second chart. The 5-minute chart is useful to check that the bigger trend is up.
- How deep can a bull flag pull back?
- Many traders want the flag to give back less than half of the pole. A deeper pullback, or one that falls under VWAP, suggests the move is failing rather than pausing.
- What is the difference between a bull flag and a pennant?
- Both are short pauses after a sharp move. A flag's highs and lows run roughly parallel, often tilted down, while a pennant's highs and lows converge into a small triangle. Traders handle them the same way: buy the break, stop under the low.
Related guides
Guide 14.6The momentum method Scalpel is built aroundThe small-cap momentum style Ross Cameron teaches, from stock selection to gap and go and micro pullbacks, mapped to Scalpel's scanner, intel and stops.Guide 5.1How Scalpel's stops workWhy Scalpel holds your stops in the app, not on the book: pre-market rules, the working stop, catastrophe net and take-profit, and what if Scalpel closes.Guide 3.5The chart: timeframes, VWAP, EMAs, MACD and deltaScalpel's chart on IBKR data, no TradingView subscription: 10s to daily bars, scroll-back history, VWAP from 04:00 ET, EMA 9 and 20, MACD and delta.
Keep reading
- The best chart setup for day trading: timeframes and indicatorsThe best chart setup for day trading: 1 and 5-minute candles, volume, VWAP, the 9 and 20 EMA and key levels, plus what research says about indicators.
- VWAP for day trading: what it is and how traders use itVWAP for day trading explained: the formula with a worked example, why 04:00 and 09:30 anchors differ, how institutions use it, and how traders read it.
- The 9 and 20 EMA for day trading: formula, lag and how to use themThe 9 and 20 EMA for day trading: the formula worked with real numbers, how much each bar counts, how traders use the pair, and what the research found.
Practice in SIM, against the live book.A lifetime license, every update included, with a 7-day refund guarantee.Ask in DiscordGet Scalpel