A day trading journal that actually improves your trading
By Scalpel Team. , updated . 8 min read.
In short
A day trading journal that improves your trading records every trade the same way: date, time, symbol, setup, entry, stop, exit, shares, fees, the result in R, and a tag for any mistake. Write each trade down within minutes, then review once a week by setup, by time of day and by mistake tag, and change one thing at a time. The point is not the diary; it is the numbers it lets you compute, like expectancy and your cost per mistake.
Most traders who keep a trading journal stop within a month, usually because it turned into a diary: long notes about how the day felt, no numbers, nothing to act on. A journal that improves your trading is closer to a lab notebook. It records the same fields for every trade so you can sort them, add them up and find the leak.
This post gives you the fields, a template you can copy into a spreadsheet, a weekly review routine, and the few numbers worth computing. It works the same whether you trade TWS, another platform or Scalpel.
Why keep a day trading journal
Two pieces of research make the case better than any trading book.
Writing progress down changes behavior. A meta-analysis of 138 randomized studies with 19,951 participants found that interventions that got people to monitor their progress toward a goal improved goal attainment, with an average effect size of d = 0.40. The effect was larger when the information was physically recorded and when it was reported or made public. That is Harkin and colleagues, "Does Monitoring Goal Progress Promote Goal Attainment?", Psychological Bulletin 142, no. 2 (2016), pages 198 to 229 (DOI 10.1037/bul0000025). The studies cover goals like exercise and diet, not trading, but the mechanism is the same: what you record, you notice.
Your memory edits your losers. Terrance Odean studied 10,000 accounts at a discount broker from 1987 to 1993, in "Are Investors Reluctant to Realize Their Losses?", Journal of Finance 53, no. 5 (1998), pages 1775 to 1798 (DOI 10.1111/0022-1082.00072). On the days they sold anything, investors realized 14.8% of the gains they could have taken, against 9.8% of the losses: a stock that was up was more than 50% more likely to be sold than one that was down. Holding losers and cutting winners is the disposition effect, and it is exactly the habit a day trader's stop is meant to kill. A journal shows you whether you have it, in numbers you cannot argue with.
What to record: the fields that matter
| Field | Example | Why it matters |
|---|---|---|
| Date and time (ET) | 2026-07-06 07:42 | Finds the hours that pay you and the ones that do not |
| Symbol | ABCD | Shows whether one lucky ticker carries your results |
| Setup | First pullback | The unit you are testing: results by setup, not overall |
| Entry, stop, exit | 4.20, 4.10, 4.38 | Needed for R, and shows whether the stop was where you planned |
| Shares | 500 | Checks your sizing was by risk |
| Risk (1R) in dollars | $50 | Entry minus stop, times shares |
| Fees | $5.00 | Results must be net, as the researchers measure them |
| Net P&L and R | +$85, +1.7R | The result in units of risk |
| Mistake tag | None, or "moved stop" | The cost of each habit, added up |
| One-line note | "Waited for the dip, took it at VWAP" | Context for the review, kept short |
Skip what you will never sort by. Mood scores and screenshots are fine if you use them; if you never look at them again, they are the reason the journal dies.
A trading journal template
Copy these columns into a spreadsheet. The two rows are worked examples with fictional tickers and IBKR Pro Fixed commissions of USD 0.005 a share with a USD 1.00 minimum per order (IBKR stock commissions, checked October 22, 2026), leaving out the small regulatory and exchange fees for clarity.
| Time | Symbol | Setup | Entry | Stop | Exit | Shares | 1R | Fees | Net | R | Tag |
|---|---|---|---|---|---|---|---|---|---|---|---|
| 07:42 | ABCD | First pullback | 4.20 | 4.10 | 4.38 | 500 | $50 | $5.00 | +$85.00 | +1.70 | None |
| 09:51 | WXYZ | High of day break | 7.55 | 7.40 | 7.28 | 400 | $60 | $4.00 | -$112.00 | -1.87 | Moved stop |
The arithmetic for ABCD: risk is (4.20 - 4.10) x 500 = $50. The gross gain is (4.38 - 4.20) x 500 = $90. Fees are $2.50 to buy and $2.50 to sell, so the net is $85, and $85 / $50 = +1.70R.
For WXYZ: risk is (7.55 - 7.40) x 400 = $60. The stop was moved instead of honored, and the exit came at 7.28: a gross loss of $108 plus $4.00 of fees, -$112, or -1.87R. That one tag cost 0.87R more than the plan allowed. Add up every "moved stop" over a month and you have the price of the habit in dollars.
R is the language of the whole journal. If it is new to you, R multiples explains it and the glossary entry on expectancy shows how it adds up.
How to keep a trading journal: the daily and weekly review
After every trade: 30 seconds
Fill in the numbers and the tag while the trade is fresh. If you are in a fast market, jot the time and symbol and fill the rest at your next pause, but before the session ends.
End of day: five minutes
Check every trade has a stop, an R and a tag. Add up the day in R, not just dollars. Write one line: what you did well and what you will do differently tomorrow.
Once a week: the real review
Sort and total the week three ways:
- By setup. Which setups have a positive average R after fees? Drop or paper trade the ones that do not.
- By hour. Which hours make money and which give it back? Many momentum traders find their edge is in the early session and their losses come later.
- By mistake tag. Total R lost to each tag. The biggest number is next week's one fix.
Change one thing
Pick one rule change from the review and only one. Two changes at once and next week's data cannot tell you which one worked.
Tags worth using
Keep the tag list short so you use it consistently:
- Chased: entered after the move, above your planned price. Our post on FOMO trading covers the rules that stop it.
- Moved stop: lowered or removed the stop after entry.
- Oversized: more risk than your preset.
- No setup: the trade was not one of your written setups.
- After the limit: traded after your daily loss limit, the classic sign of revenge trading.
- Early exit: sold a working trade before your exit rule said so.
The numbers to compute
Once you have 50 or more trades of one setup, these tell you whether it works:
| Number | How to work it out |
|---|---|
| Win rate | Winners divided by all trades |
| Average win and average loss, in R | The mean R of your winners, and of your losers |
| Payoff ratio | Average win divided by average loss |
| Expectancy | (Win rate x average win R) - (loss rate x average loss R): what one more trade is worth |
| Profit factor | Dollars won divided by dollars lost |
| Max drawdown | The deepest fall in your running P&L from a high |
A worked expectancy: a 45% win rate, an average win of +1.8R and an average loss of -1.0R give (0.45 x 1.8) - (0.55 x 1.0) = 0.81 - 0.55 = +0.26R a trade. At $50 a risk unit, that is $13 a trade before any slippage you have not yet recorded.
Be careful with small samples. A win rate measured over 20 trades says very little.
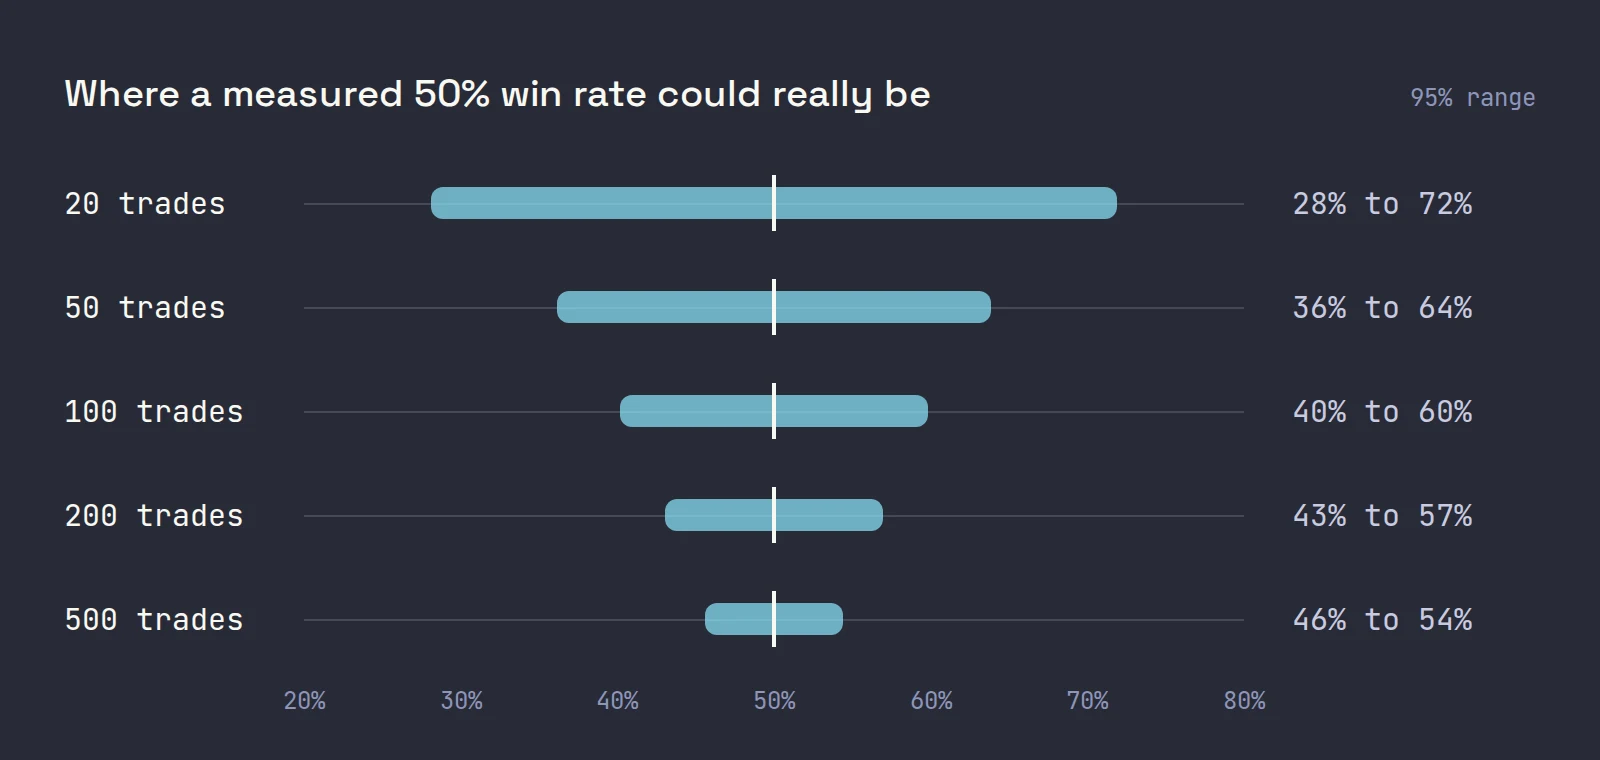
Over 20 trades, a measured 50% win rate is consistent with a true rate anywhere from about 28% to 72%. It takes about 200 trades to narrow that to roughly 43% to 57%. Our post on how long it takes to learn day trading works through what that means in weeks.
Getting your fills out of Interactive Brokers
You do not have to type every fill. In IBKR's Client Portal, Performance & Reports > Flex Queries lets you build an Activity or Trade Confirmation Flex Query with exactly the fields you want and download it in a format a spreadsheet opens (the Activity Flex Query offers CSV); saved queries cover the four previous calendar years and the current one (IBKR: Flex Queries, creating a Flex Query). Paste the fills in, then add the parts IBKR cannot know: the setup, the planned stop and the tag.
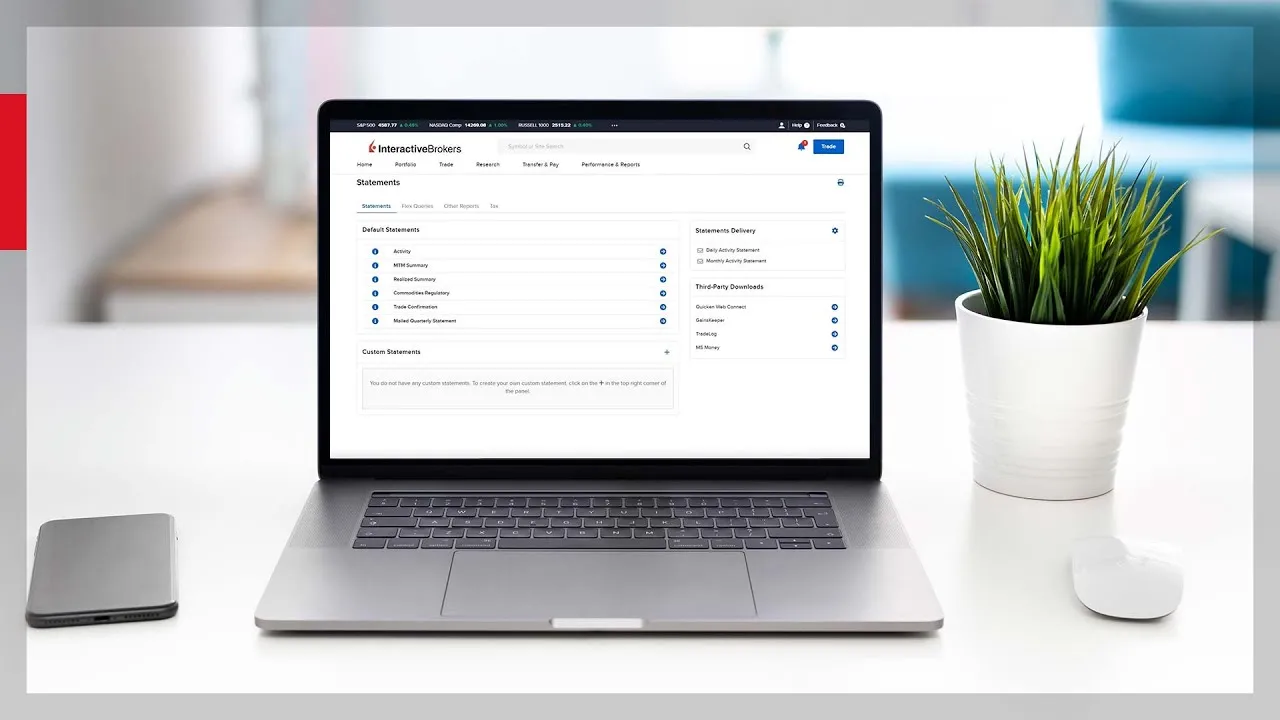
IBKR's overview of its reporting tools shows where statements and custom reports live in Client Portal, a useful map before you build your first Flex Query.
Keep the broker records as well as your journal. The IRS says to keep records for 3 years in the ordinary case, longer in some situations (IRS: how long should I keep records). This is general information, not tax advice; our post on day trading taxes goes further.
Scalpel is independent and not affiliated with or endorsed by Interactive Brokers.
Spreadsheet, app or notebook?
Use whatever you will still be using in six months. A spreadsheet is enough for everything in this post and lets you sort and total freely. A dedicated journal app saves typing if it imports your broker's fills. A paper notebook works for the notes and the tags, but you will want the numbers somewhere you can add them up. The format matters far less than recording the same fields every time, starting with your paper trading: a paper journal tells you more than a paper P&L.
Where Scalpel fits
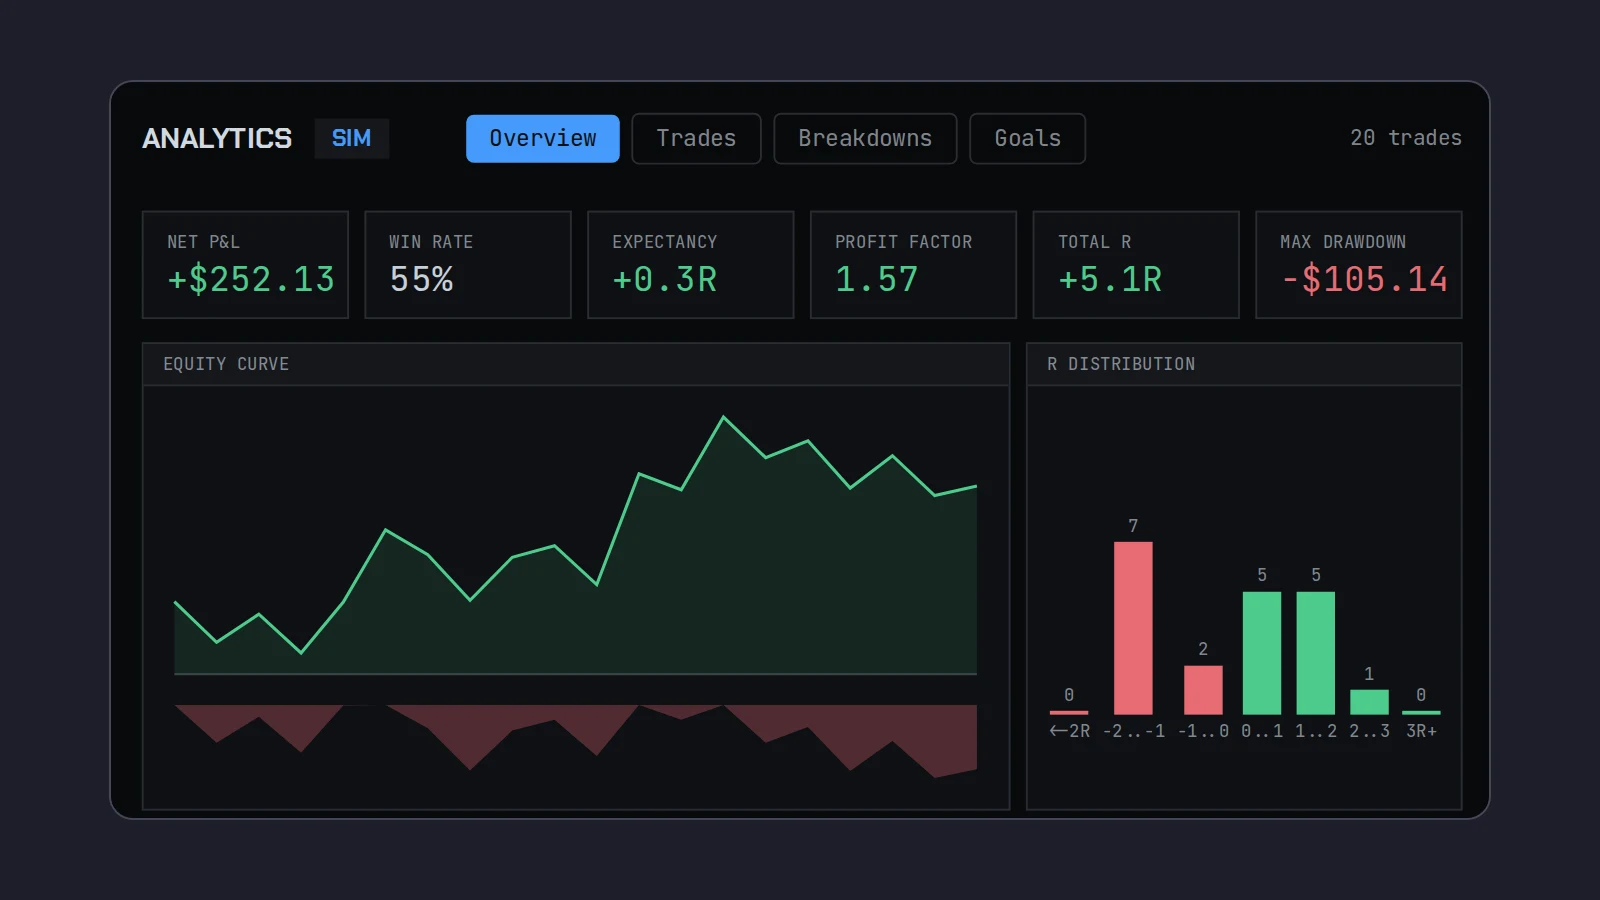
Scalpel journals every closed trade for you, in SIM and LIVE separately, whether it closed by a key, a stop, a take-profit or a flatten. Each one is written with its entry, exit, size, fees and R, and Analytics turns the journal into the numbers above: net P&L, win rate, expectancy in R, profit factor, max drawdown, an R distribution, and breakdowns by symbol and by New York hour (guide 6.4). A loser outside the -1..0 bucket in the R distribution is a stop that was moved, ignored or gapped.
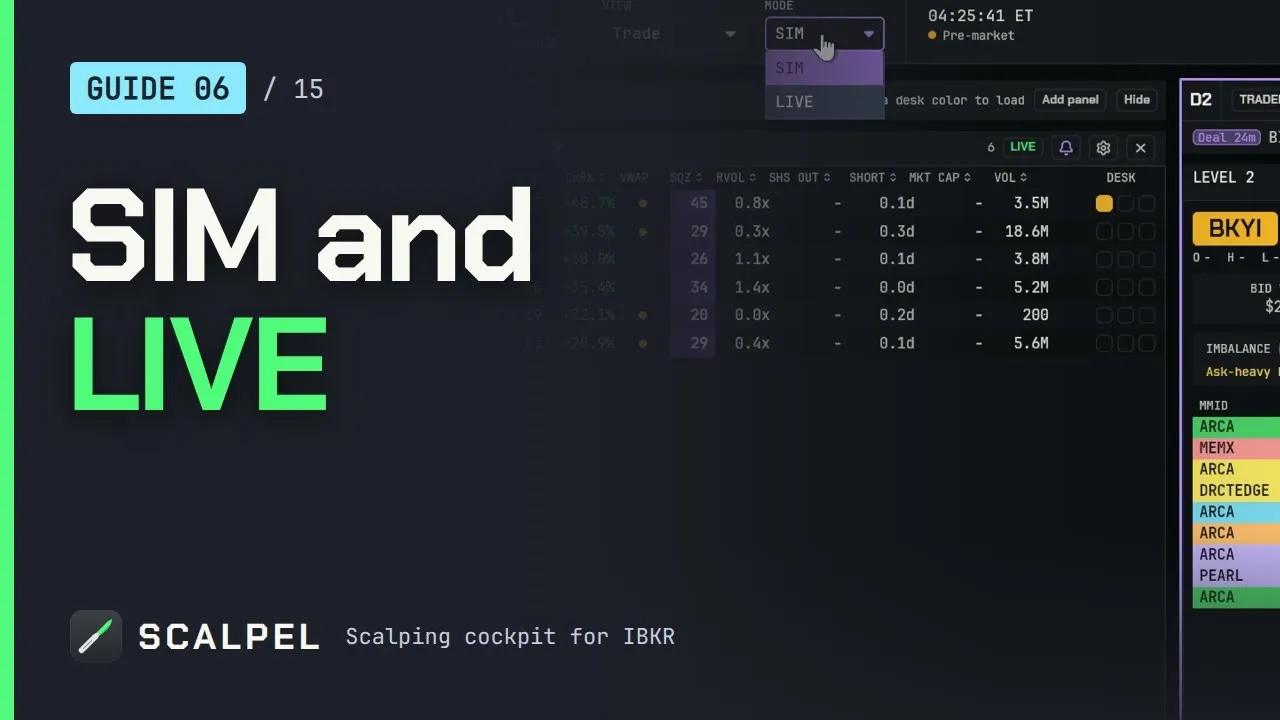
What Scalpel does not record is why you took the trade. Keep a short setup and tag column next to it; the journal file is plain text, one trade per line, in Scalpel's data folder (journal/sim-trades.jsonl and journal/live-trades.jsonl), so you can join the two. The first week in SIM ends with exactly this kind of weekly review. This video from our guides shows SIM, LIVE and the journal each keeps.
For where journaling fits in the larger plan, from the odds to a first live trade, see how to start day trading.
Trading carries a significant risk of loss. Nothing here is financial advice.
Questions
- What should be in a day trading journal?
- For every trade: date and time, symbol, setup, entry, stop, exit, shares, fees, net P&L, the result in R, and a tag for any mistake. Add a one-line note if it helps you remember the context.
- How do I keep a trading journal?
- Record each trade within minutes, check the day's entries at the close, and do a real review once a week by setup, by hour and by mistake tag. Change one rule at a time based on what the review shows.
- Is a spreadsheet good enough for a trading journal?
- Yes. A spreadsheet can hold every field and compute win rate, expectancy and profit factor. Use whatever you will keep using; consistency matters more than the tool.
- How many trades do I need before my journal means anything?
- At least 50 trades of one setup, and more is better. Over 20 trades, a 50% win rate could plausibly be anywhere from about 28% to 72%; over 200 trades the range narrows to about 43% to 57%.
- Can I export my trades from Interactive Brokers?
- Yes. In Client Portal, Performance and Reports, Flex Queries lets you build a custom report of your trades with the fields you choose and download it for a spreadsheet.
Related guides
Guide 6.4Analytics: review your tradingScalpel's Analytics view: equity curve, win rate, expectancy, profit factor, R distribution, every trade, results by symbol and hour, and a trader grade.Guide 5.4R multiples: how Scalpel measures a tradeWhat R is, how Scalpel shows P&L in R on the chart and in the orders panel, how take-profit at N x R works, and why R makes trades on any stock comparable.Guide 14.5Your first week: a SIM practice planA day-by-day SIM plan for your first week with Scalpel: keys, sizing, stops, scanning and review in Analytics, so you go live with habits, not hope.
Keep reading
- How to start day trading in 2026: a realistic planHow to start day trading in 2026: the honest odds, the money and rules after the PDT change, one setup, simulator practice, a journal and going live small.
- Day trading statistics: what the research says about who makes moneyDay trading statistics from primary research: 97% of persistent Brazilian day traders lost money, under 1% in Taiwan profit reliably. Samples and limits.
- Paper trading: does it work, and how to make it countDoes paper trading work? Where simulated fills lie, IBKR's paper account limits, how to make practice realistic, and when to switch to live trading.
Practice in SIM, against the live book.A lifetime license, every update included, with a 7-day refund guarantee.Ask in DiscordGet Scalpel