The real cost of day trading: commissions, fees, data and slippage
By Scalpel Team. , updated . 7 min read.
In short
The cost of day trading on Interactive Brokers, for a trader making 10 round trips a day of 500 shares at $5, is about $1,093 a month before slippage: $1,050 in IBKR Pro Fixed commissions, about $10.50 in SEC fees, under $1 of CAT fees and $32 of market data. Slippage is the cost that decides it: at just 1 cent a share each way it adds $2,100, for about $3,193 a month, or $15.21 per round trip. On a $50 risk per trade that is 0.30R, so a strategy needs an edge above 0.30R a trade just to break even.
Ask how much day trading costs and most answers stop at the commission. That is the smallest number on this page that you can do something about, and not the biggest. This post builds one month of costs for a realistic small-cap scalper on Interactive Brokers, line by line, using IBKR's published prices checked today, then turns the total into R, the unit that tells you whether your edge survives it.
Scalpel is independent and not affiliated with or endorsed by Interactive Brokers.
The example trader
- Account: IBKR Pro, US resident, non-professional market data.
- Trading: 10 round trips a day, 500 shares at $5.00, both sides with marketable limit orders, 21 sessions a month. That is 210 round trips and 210,000 shares a month.
- Risk: $50 per trade (1R), stops sized from that.
Change any of these and the table changes, so we show the per-trade math too.
How much does day trading cost a month?
| Cost | IBKR Pro Fixed | IBKR Pro Tiered, taking both sides | Source |
|---|---|---|---|
| Commissions | $1,050.00 | about $1,407.54 | IBKR commissions page |
| SEC fee on sales | about $10.50 | about $10.50 | SEC fee rate advisory |
| FINRA TAF on sales | $0.00 (fee holiday to December 31, 2026), then about $21.00 | Same | FINRA rule filing |
| CAT fee | under $1 | under $1 | IBKR commissions page |
| Market data, with Level 2 | $32.00 | $32.00 | IBKR market data pricing |
| Platform | $0 for TWS | $0 for TWS | |
| Subtotal | about $1,093 | about $1,451 | |
| Slippage at 1 cent a share each way | $2,100.00 | $2,100.00 | Assumption, see below |
| Total | about $3,193 | about $3,551 |
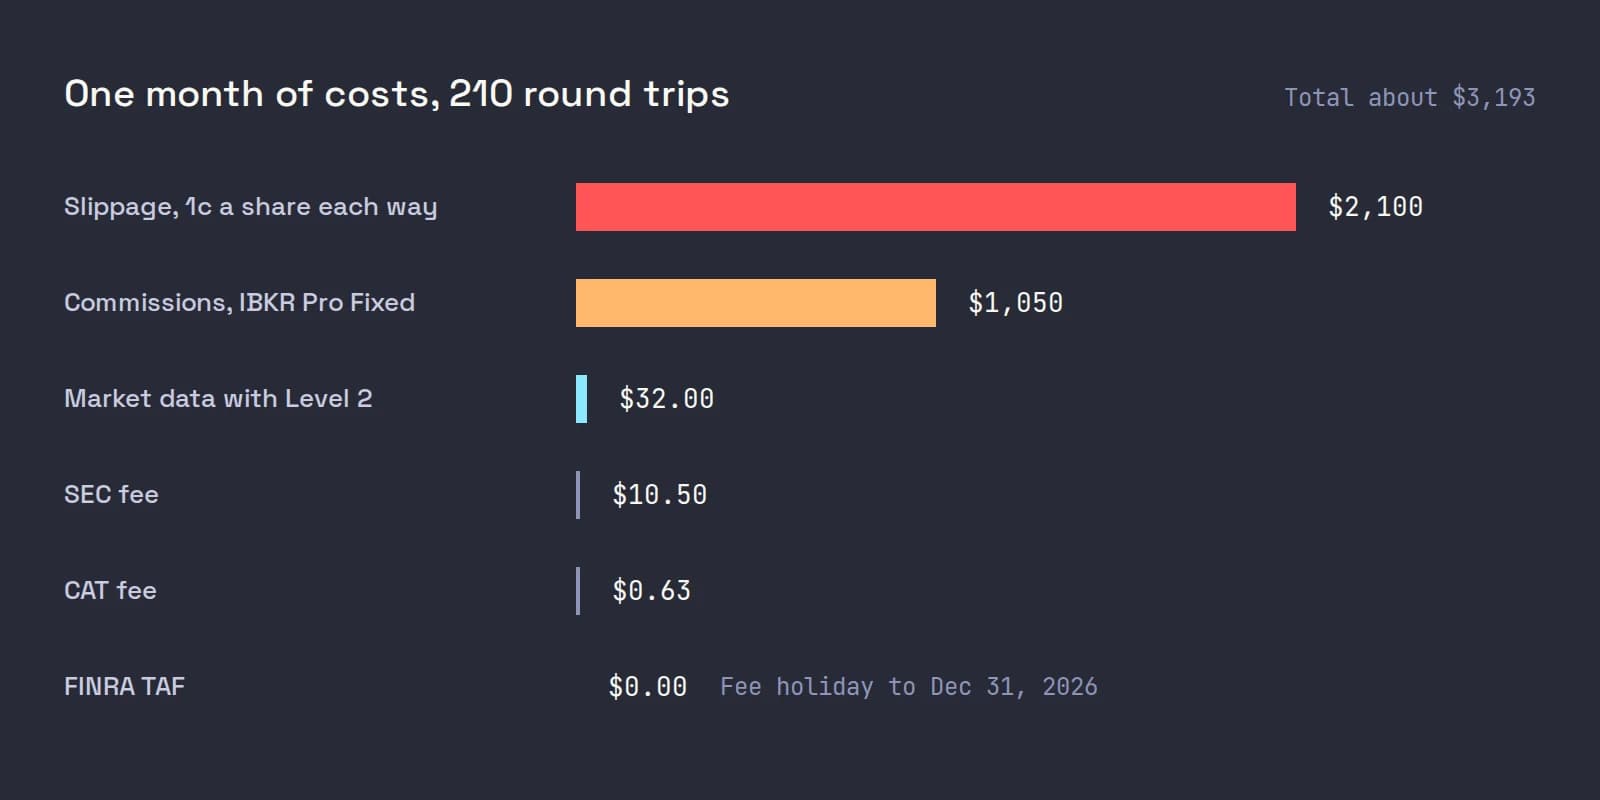
Each line is explained below. The big point is visible already: the slippage assumption alone is twice the commission bill, and everything regulatory together is under 1% of the total.
Day trading fees: commissions on IBKR
From IBKR's US stock commissions page, checked on October 22, 2026:
- IBKR Pro Fixed: $0.005 a share, $1.00 minimum, 1% of trade value maximum, exchange and clearing fees included. A 500-share fill is $2.50, so a round trip is $5.00.
- IBKR Pro Tiered: $0.0035 a share up to 300,000 shares a month, $0.35 minimum, plus exchange, clearing and pass-through fees. A 500-share fill that takes liquidity on Nasdaq adds $0.003 a share of exchange fee, per IBKR's Nasdaq fee table, and $0.0002 of clearing: about $3.35 a fill, $6.70 a round trip.
At 210,000 shares a month the trader stays in Tiered's first tier, so Fixed is cheaper for this pattern. If the exits rested on the book and earned rebates, Tiered would win. The full comparison, with 5, 20 and 50 round trips, is in IBKR Tiered vs Fixed. IBKR Lite charges $0 on US exchange-listed stocks but does not support the API, which matters if you use any third-party trading software.
Per round trip at other sizes, taking liquidity both ways:
| Round trip | Fixed | Tiered |
|---|---|---|
| 200 shares at $3.00 | $2.00 | $2.68 |
| 500 shares at $5.00 | $5.00 | $6.70 |
| 1,000 shares at $2.00 | $10.00 | $13.41 |
Regulatory fees: SEC, FINRA and CAT
Three small fees apply on top of either plan. The SEC fee is $20.60 per million dollars sold since April 4, 2026, per the SEC's fiscal year 2026 fee rate advisory: a $2,500 sale pays about 5 cents. The FINRA trading activity fee is $0.000195 a share sold, capped at $9.79, but FINRA's filing SR-FINRA-2026-021 set it to zero for trades from October 1 to December 31, 2026; on 500 shares it will be about 10 cents. IBKR also lists a consolidated audit trail fee of $0.000003 a share. The rates, their history and worked examples are in SEC fee and FINRA TAF.
For this trader they add up to about $11 a month now and about $32 from January 2027. Real, but not where the money goes.
Market data for day trading
A scalper needs live quotes and at least one depth-of-book feed. From IBKR's market data pricing page, non-professional prices:
| Subscription | Monthly |
|---|---|
| US Securities Snapshot and Futures Value Bundle | $10.00, waived in a month with $30 of commissions |
| US Equity and Options Add-On Streaming Bundle | $4.50 |
| NASDAQ TotalView-OpenView (Level 2) | $16.50 |
| NYSE ArcaBook (Level 2) | $11.00 |
| Total | $42.00, or $32.00 with the waiver |
This trader pays $1,050 in commissions, so the $10 bundle is waived. IBKR also requires at least $500 of equity in an individual account to hold market data subscriptions, on top of their cost. Which feeds to pick, and why, is in our post on IBKR Level 2 and the market data guide. Professional data costs far more: the same add-on bundle is $125.00 a month for professionals.
IBKR's lesson on market data explains why exchanges charge for quotes, the equity minimum that applies, and where in Client Portal you add or cancel a subscription.

Spread and slippage: the cost nobody invoices
Slippage is the gap between the price you meant to trade at and the price you got. On a marketable buy it is how far above the ask you filled; on a stop-out it is how far below the stop. It never appears on a statement, which is why it is so easy to ignore. It is also the bid-ask spread you cross every time you buy at the ask and sell at the bid.
We assumed 1 cent a share on each side. On a liquid $5 stock in regular hours that is modest. On a thin small cap before the open, where 5 to 10 cent spreads are normal, it is optimistic. Here is how the month moves with it, still 500 shares and 210 round trips:
| Slippage per share, each way | Per round trip | Per month | In R, at $50 risk |
|---|---|---|---|
| 0 cents | $0.00 | $0 | 0.00R |
| 1 cent | $10.00 | $2,100 | 0.20R |
| 2 cents | $20.00 | $4,200 | 0.40R |
| 5 cents | $50.00 | $10,500 | 1.00R |
At 5 cents each way the trader gives away a full R on every trade before commissions. Nothing else on this page comes close. How to measure your own number from fills, and how to cut it, is in slippage in day trading.
The cost of day trading in R
Dollar totals hide the real question, which is whether your edge survives its costs. Divide the cost per trade by your risk per trade:
| Per round trip, Fixed | Dollars | In R ($50 risk) |
|---|---|---|
| Commissions and regulatory fees | $5.05 | 0.10R |
| Market data ($32 over 210 trades) | $0.15 | under 0.01R |
| Slippage at 1 cent each way | $10.00 | 0.20R |
| Total | $15.21 | 0.30R |
So a strategy with an expectancy of +0.25R before costs loses money. The same trades taken with $25 of risk would cost 0.61R each, which is why small accounts that trade full share size on tight stops have the hardest time: the costs are per share, the risk is not. Size from the stop, and look at cost per R, not cost per trade.
Other day trading expenses
- Taxes. In the US, day trading gains are usually short-term capital gains, taxed at ordinary income rates, and the wash sale rule can defer losses. See day trading taxes; this is general information, not tax advice.
- Software. TWS is free. Paid platforms and add-ons range from monthly subscriptions to one-time licenses. Scalpel, for example, is $299 once.
- Hardware and internet. A one-time cost for most people: a fast, reliable connection matters more than a powerful computer.
- Learning losses. The money lost while learning is a cost too, and usually the largest. Practicing on paper first is the cheapest way to pay it.
Where Scalpel fits
Scalpel cannot lower IBKR's prices. It makes the costs visible on every trade, which is what changes behavior.
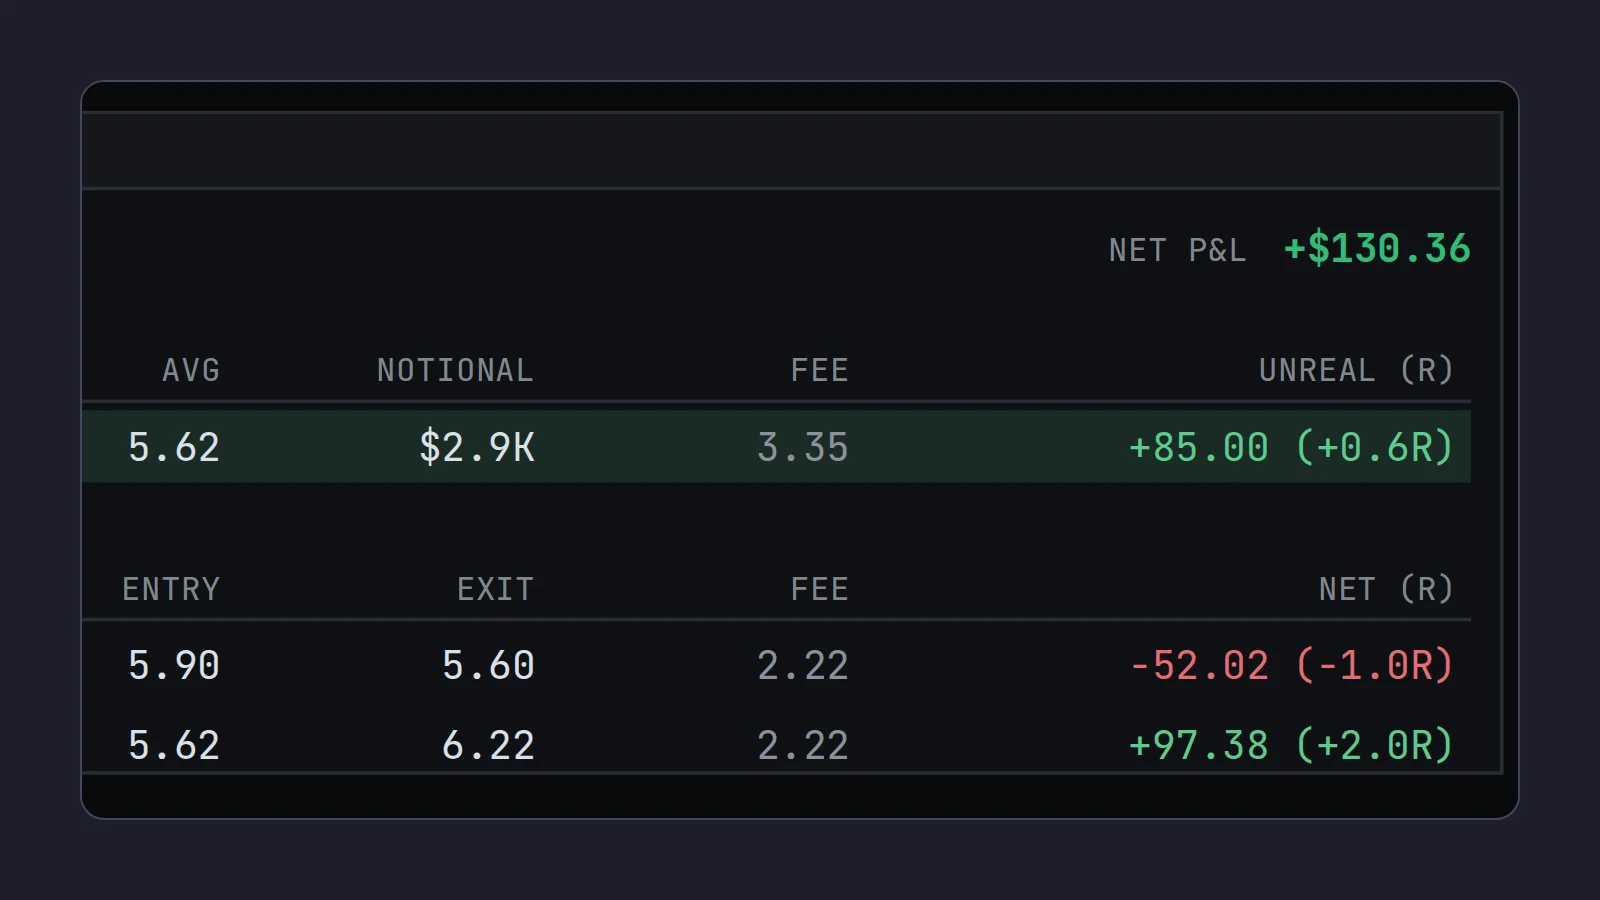
In LIVE, the FEE column shows the commission IBKR reports for each fill, and every P&L figure, R multiple and Analytics stat is net of it. Analytics shows the month's total as COMMISSIONS on the Overview, next to your expectancy in R (analytics guide).
In SIM, pick your IBKR plan in Settings > Risk > Commission plan so paper fills pay what live ones would (commissions guide). Then set SIM slippage (c): it makes every SIM fill that many cents a share worse, buys higher and sells lower, stop-outs included. The default is 0. Setting it to 1 or 2 is the honest way to find out whether your paper edge survives the slippage line above before real money finds out for you (paper trading in SIM).
SIM leaves regulatory fees on sales out, so it reads a few cents better per sale than LIVE. This short video shows how SIM and LIVE differ:
For the rules that come with these costs, from intraday margin to settlement, see day trading rules.
Prices and fees checked on October 22, 2026, on the Interactive Brokers, SEC and FINRA pages linked above. They change, so check before you rely on them.
Trading carries a significant risk of loss. Nothing here is financial advice.
Questions
- How much does day trading cost per month?
- For 10 round trips a day of 500 shares at $5 on IBKR Pro Fixed, about $1,093 a month in commissions, regulatory fees and market data. Slippage of 1 cent a share each way adds about $2,100, for roughly $3,193 in total.
- What fees do day traders pay?
- Broker commissions, exchange and clearing fees on some plans, the SEC fee and FINRA trading activity fee on every sale, market data subscriptions, and the spread and slippage paid on every fill. Taxes on gains come on top.
- Is commission the biggest cost of day trading?
- Usually not. For a small-cap scalper, slippage and the bid-ask spread typically cost more than commissions. At 1 cent a share each way, slippage is about twice the commission bill on IBKR Pro Fixed.
- How much is Level 2 market data on IBKR?
- For non-professionals, NASDAQ TotalView-OpenView is $16.50 a month and NYSE ArcaBook $11.00, on top of about $14.50 of live US quotes, with $10 of that waived in a month with $30 of commissions. Check IBKR's market data pricing page for current prices.
- How do I know if my strategy covers its costs?
- Divide your all-in cost per round trip by your risk per trade to get the cost in R. If your expectancy before costs is not clearly above that number, the strategy loses money. With $15 of costs on $50 of risk, you need more than 0.30R a trade.
Related guides
Guide 6.3Commissions: pick your IBKR planMatch Scalpel's SIM fees to your Interactive Brokers plan: Pro Tiered, Pro Fixed, Lite or custom, plus exchange and clearing fees, and the FEE column.Guide 1.6The IBKR market data you need for Level 2The IBKR market data that gives Scalpel live quotes, Level 2 and the tape, with no third-party feed to pay for, and how delayed or missing data shows.Guide 6.1Paper trading with SIMSIM fills your orders against the live Level 2 book, with partial fills, slippage and commissions. How it works, its paper ledger, and how to reset it.
Keep reading
- Day trading rules in 2026: every rule a US stock trader should knowDay trading rules for 2026: the PDT rule replaced by intraday margin, T+1 settlement, LULD halts, SSR, wash sales and taxes, each with its source.
- The PDT rule is gone: what changed for day trading on Interactive BrokersYes: IBKR began dropping the PDT rule on June 4, 2026. No $25,000 minimum, no day trade count. What replaced it, a worked example and who is still on it.
- IBKR Tiered vs Fixed for scalpers: the math on real tradesTiered vs Fixed pricing explained simply: Fixed is one flat rate a share, Tiered a lower rate plus exchange fees. Which is cheaper on IBKR, worked out.
Practice in SIM, against the live book.A lifetime license, every update included, with a 7-day refund guarantee.Ask in DiscordGet Scalpel