Short squeeze explained: short interest, borrow and days to cover
By Scalpel Team. , updated . 9 min read.
In short
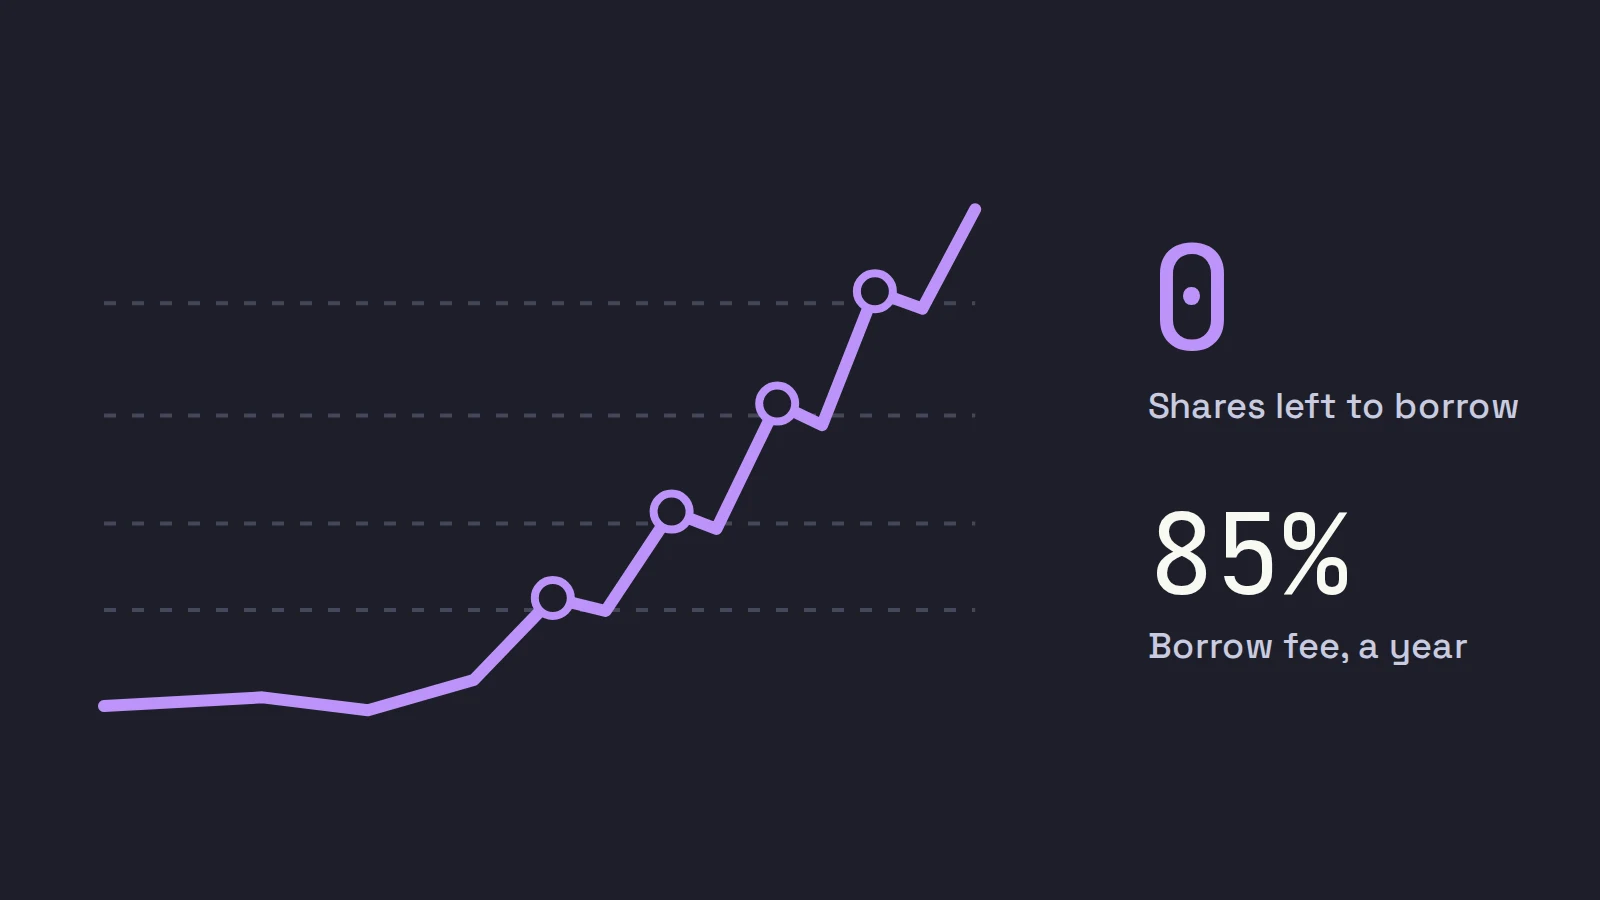
Short squeeze explained: a rising price forces short sellers to buy back the shares they borrowed and sold, and their buying pushes the price higher still. You measure the fuel with three numbers: short interest (FINRA publishes it twice a month, about a week after each date), days to cover (short interest divided by average daily volume) and borrow (the fee and the shares left to short, which change live). Squeezes are rarer than social media suggests: heavily shorted stocks have on average done worse, not better, and even in GameStop the SEC found covering was a small fraction of the buying.
"Short squeeze" gets attached to almost every small cap that runs. Most of those runs are plain buying on news. A real squeeze needs a crowded short side that cannot add, a price move that hurts it, and buyers who keep coming while the shorts cover. This post explains the mechanics, what each short number means and how old it is, the GameStop numbers from the SEC's own report, and how a long-only trader can use short data without being fooled by it. Rules and data sources were checked on October 22, 2026.
Short squeeze explained
A short seller borrows shares, sells them, and hopes to buy them back cheaper later. Before a broker accepts a short sale, Regulation SHO Rule 203(b)(1) requires it to have borrowed the stock, arranged to borrow it, or have "reasonable grounds to believe that the security can be borrowed": the locate. The borrowed shares cost a fee, and the short has to keep enough margin in the account as the price moves.
The short's risk is open-ended. A stock bought at $4 can only fall to zero; a stock shorted at $4 can go to $8, $12 or $20. So when the price rises sharply, shorts face margin calls, hit their stops, or simply give up, and every one of those exits is a buy order. This is how short squeezes work in a stock with a small float and a crowded short side: the buy orders arrive together.
- A catalyst or a scanner alert brings in buyers.
- The price breaks a level the shorts were defending, often VWAP or the high of the day.
- Shorts with stops above that level buy to cover. Their buying lifts the price.
- The higher price triggers the next group of stops and margin calls.
- The loop runs until the shorts who must cover have covered, then the forced buying stops, often all at once.
That last step matters as much as the first four. A squeeze is a burst of forced demand, not a change in the company, and it ends where it ends: frequently at the top of the spike. The glossary entry on short squeezes has the one-line version.
Short interest: what FINRA publishes and when
Short interest is the total number of shares sold short and not yet bought back. In the US, FINRA Rule 4560 requires member firms to report their short positions twice a month:
| Step | When |
|---|---|
| Positions measured | On the 15th (or the settlement day before it) and on the last settlement day of the month |
| Firms report to FINRA | By 6 p.m. ET on the second business day after that date |
| FINRA publishes | On the seventh business day after that date |
So the newest short interest figure is at least about a week and a half old when it appears, and just before the next release it is over three weeks old. On a small cap that has traded its whole float several times since, the short position may look nothing like the published one. FINRA publishes the data for all exchange-listed and OTC stocks, free.
Two traps in the headline percentage:
- Percent of what? Short interest is reported in shares. Data sites divide it by the float or by shares outstanding, and the float version is always the bigger number. Check which one you are reading. The low float stocks pillar explains why the two bases differ.
- Over 100% is possible. If a buyer of shorted stock lends those shares out again, the same share is short twice. The SEC's staff report on the January 2021 meme stock episode gives exactly this example to explain how GameStop's short interest passed 100%.
Days to cover
Days to cover is FINRA's "number of days of average share volume it would require to buy all of the shares that were sold short", calculated as short interest divided by average daily share volume (FINRA's short interest glossary). FINRA's average is taken over the trading days between the previous settlement date and the current one.
A worked example. WXYZ has 1,200,000 shares short in the latest report, and averaged 400,000 shares a day over the period:
1,200,000 / 400,000 = 3.0 days to cover.
Now WXYZ gaps up 70% on news and trades 15 million shares by midday. Measured against today's volume, the whole short position is 1,200,000 / 15,000,000 = 0.08 of a day. That is the weakness of days to cover on small caps: it is computed on normal volume, and a stock in play trades many times its normal volume. A high reading says the short side is large relative to an ordinary day. It does not say shorts are stuck on a day when 15 million shares change hands.
Borrow: the live part of the picture
Short interest and days to cover are old by the time you read them. What changes during the session is the stock loan market: how many shares are left to borrow, and what borrowing them costs.
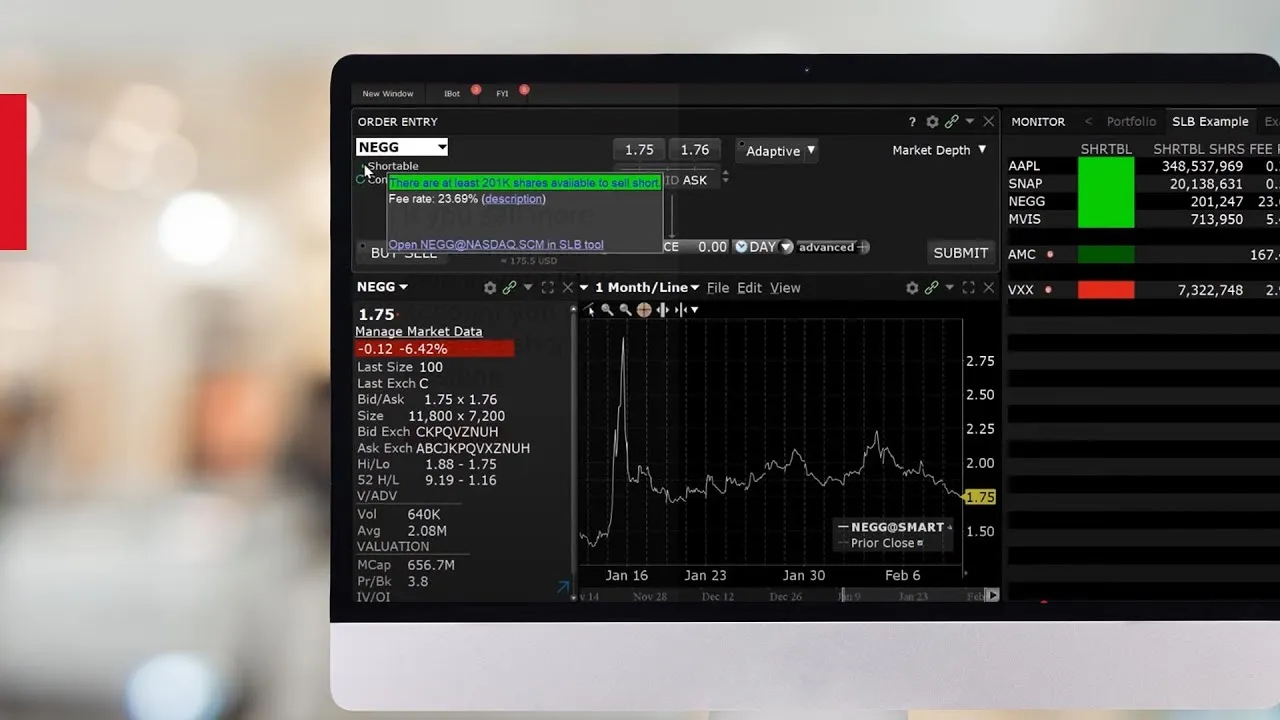
- The borrow fee is an annual rate the short pays on the value of the borrowed shares. Interactive Brokers' short sale cost page says costs "may be elevated due to supply and demand dynamics in the Securities Lending market".
- Shares available can fall to zero during a run. Once no shares are left, no new shorts can open, and the existing ones become the only sellers who must eventually buy.
IBKR's own video shows where TWS displays shares available to short and the borrow fee rate, the two numbers to watch during a run, and you do not need to short anything to use them.
Most stocks are cheap to borrow, which is what makes a high fee informative. In The Market for Borrowing Stock (Journal of Financial Economics, 2002), Gene D'Avolio found that 91% of the stocks lent out in his sample cost less than 1% a year to borrow, while only 9%, about 206 stocks a day, were "specials" above 1%, with a mean fee of 4.3%. A small cap paying 50% or 100% a year is in a different world from those averages: shorts are paying heavily every day they stay in.
Two related reads:
- IBKR's own borrow data, and what a spiking fee means for a long: IBKR borrow fees and shortable shares.
- A list of stocks with persistent delivery failures, often from heavy shorting: the Reg SHO threshold list.
The GameStop squeeze in numbers
The SEC staff's Staff Report on Equity and Options Market Structure Conditions in Early 2021 is the most careful public study of a squeeze, and its numbers are worth knowing:
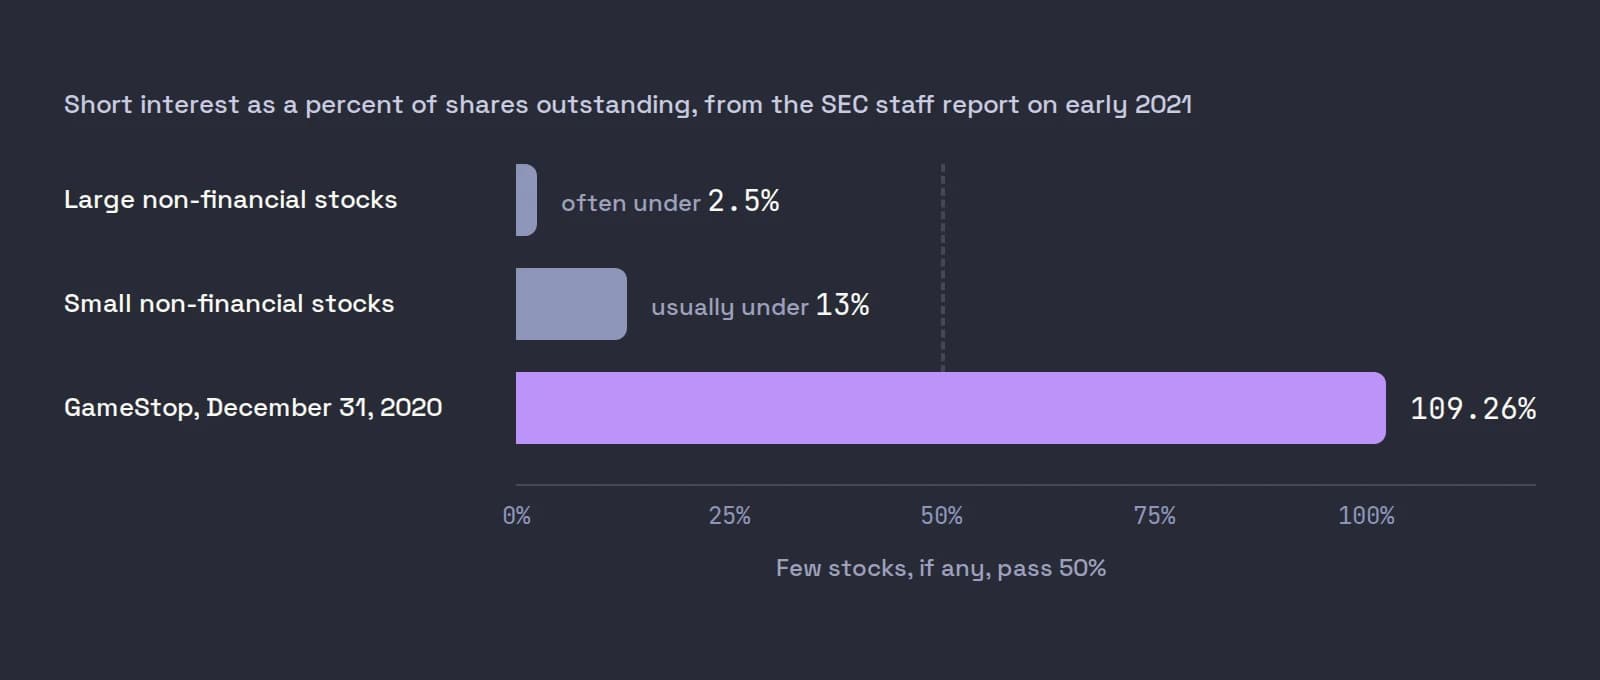
- GameStop's short interest hovered around 100% of shares outstanding through 2020, hitting 109.26% on December 31, 2020. As a percent of float it reached 122.97% in January 2021.
- For comparison, short interest in large non-financial stocks is often under 2.5%, and in small non-financial stocks it still tends to be under 13%. Few stocks, if any, have more than 50% on a given date.
- The stock closed at a high of $347.51 on January 27, 2021, more than 1,600% above its January 11 close, and hit an intraday high of $483.00 the next day.
Then the finding that matters for every squeeze story since. Staff saw that buying by accounts with large short positions coincided with the run-up, but that "such buying was a small fraction of overall buy volume", and that prices stayed high after covering would have faded. Their conclusion: "it was the positive sentiment, not the buying-to-cover, that sustained the weeks-long price appreciation".
In other words, even the most famous squeeze of the decade was mostly a buying story. Short covering added fuel; buyers kept the fire going.
Why short squeezes are rarer than claimed
If high short interest reliably led to squeezes, buying the most shorted stocks would be a strategy. The evidence says the opposite on average. Asquith, Pathak and Ritter, in Short Interest, Institutional Ownership, and Stock Returns (Journal of Financial Economics, 2005), found that stocks with high short interest and low institutional ownership (their proxy for a scarce supply of shares to lend) underperformed by 215 basis points a month on an equally weighted basis over 1988 to 2002, though only an insignificant 39 basis points value weighted. Short sellers are often right about weak companies.
On small caps, three more things work against the squeeze story:
- The company can sell into it. A cash-hungry company with a shelf can sell new stock into the very spike that would squeeze the shorts. New supply relieves the shorts and caps the run. See ATM offerings.
- The data is stale. A large short interest from three weeks ago may already have covered on the last run.
- Shorts are not all directional. Market makers short to fill buyers when they have no inventory, which the SEC report also notes. Some short volume is liquidity, not a bet.
None of this makes squeezes imaginary. They happen, and they can be violent. It means short data is a reason to watch a stock, not a reason to buy it.
Reading short data as a long-only trader
You do not need to short to use short data. As a long, the questions are: is there forced demand waiting above, and is anything going to cancel it?
| Read | Supports a squeeze | Works against it |
|---|---|---|
| Short interest | A large share of a small float | Small, or weeks old with heavy volume since |
| Days to cover | Several days on normal volume | Under a day, or trivial against today's volume |
| Borrow fee | High and rising today | Low, or falling as shorts cover |
| Shares available | None left | Plenty left |
| Dilution | No shelf, no recent offering | A 424B5 or an active ATM |
| Price action | Holding above VWAP, breaking the high on volume | Fading under VWAP on light volume |
A setup with trapped shorts still needs buyers. The trade usually comes from a push through a level shorts care about, VWAP or the high of day, with real volume on the tape, and the exit plan matters more than usual because the forced buying ends abruptly.
Where Scalpel fits
Scalpel is long only: every sell is capped to the shares you hold, so it cannot short. It reads the short side as information for a long trade, from free sources: FINRA short interest and days to cover in the SHORT column, IBKR's live shortable data and public stock-loan file, the Nasdaq Reg SHO threshold list and FINRA daily short volume (borrow and short squeezes guide).
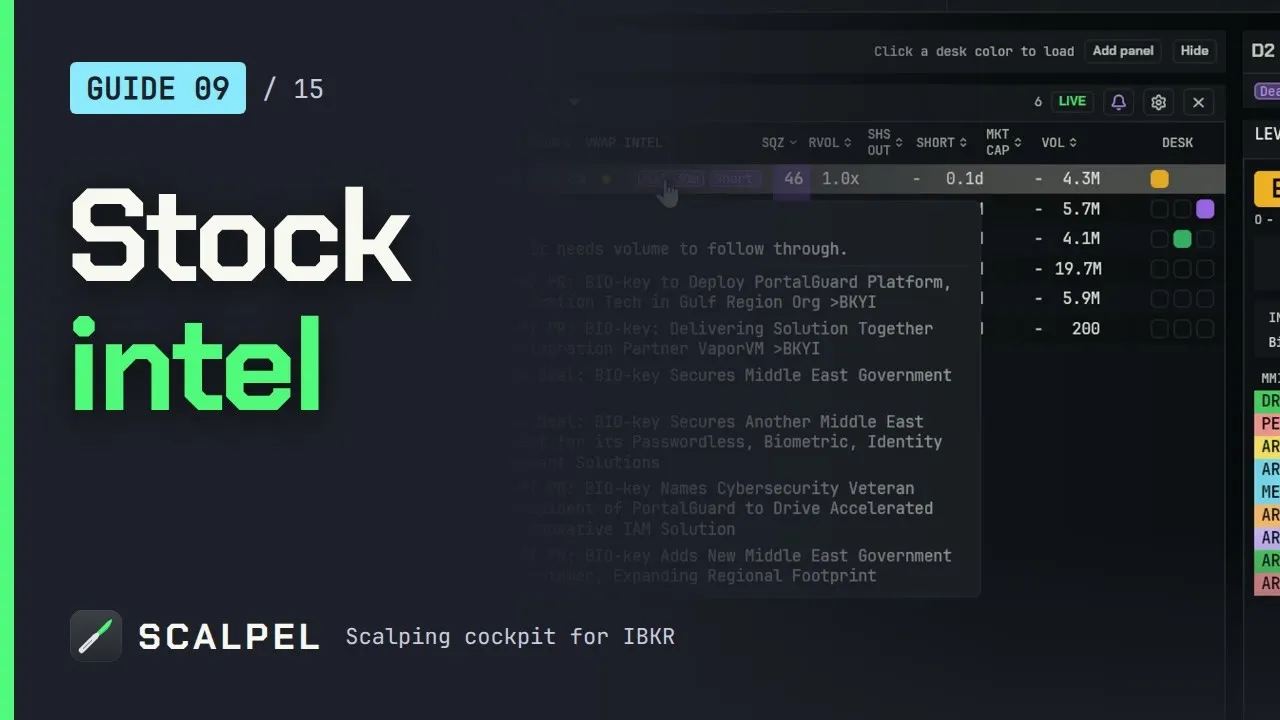
On a scan row, a violet chip says how trapped the shorts are: Can't short when no shares are left to borrow, Short fee 85% when the fee is 20% a year or more, Hard to short when a locate is needed. SQZ combines supply, live borrow, relative volume, short interest, price and company size into a 0 to 100 score, and halves it when the company is selling stock (SHS OUT, SHORT and SQZ).
The intel video shows the borrow chips and the squeeze score on a scan panel:
The intel chips guide lists every chip, and long only explains why Scalpel never shorts. Its stops are watched by the app, not resting at IBKR, so they only work while Scalpel runs with a live feed. Scalpel is independent and not affiliated with or endorsed by Interactive Brokers.
Trading carries a significant risk of loss. Nothing here is financial advice.
Questions
- What is a short squeeze in simple terms?
- A rising price forces short sellers to buy back the shares they sold, and their buying pushes the price higher, which forces more of them to buy. It ends when the shorts who must cover have covered.
- How often is short interest reported?
- Twice a month. FINRA member firms report positions as of the 15th and the last settlement day of each month, and FINRA publishes the data on the seventh business day after each date.
- What is a good days to cover for a short squeeze?
- There is no magic number. Several days of normal volume means a crowded short side, but on a small cap trading ten times its normal volume, the whole short position can be a fraction of one day's trading.
- Can short interest be more than 100 percent?
- Yes. When shares bought from a short seller are lent out and sold short again, the same share is counted twice. GameStop's short interest reached 122.97% of its float in January 2021, according to the SEC staff report.
- Does high short interest mean a stock will go up?
- No. On average, heavily shorted stocks with little stock to borrow have done worse, not better. High short interest is fuel for a squeeze only if buyers show up and the company does not sell new stock into the move.
- What is the difference between short interest and short volume?
- Short interest is the open short position on a date. Short volume is the number of shares sold short during a day, which includes market makers selling short to fill buyers. Short volume is not the size of the short position.
Related guides
Guide 9.3Borrow, short fees and squeeze setupsRead borrow like a squeeze trader: shares left to short, the borrow fee, the Reg SHO threshold list and short volume, combined into Scalpel's borrow chips.Guide 8.4Shares out, short interest and the squeeze scoreWhy Scalpel shows shares outstanding instead of float, how FINRA short interest and days to cover are dated, and what goes into the 0 to 100 squeeze score.Guide 9.5Every intel chip, explainedEach intel chip on Scalpel's scan rows and desk strips, from Selling and Warrants near to FDA, Can't short and Short fee: what it means for a long trade.
Keep reading
- Low float stocks: what float means and why runners moveLow float stocks explained: what float is, float vs shares outstanding, where to find it free on SEC EDGAR, and why low float runners move so fast.
- How to check dilution on SEC EDGAR, step by stepHow to check dilution on SEC EDGAR: the forms that mean a sale (S-3, 424B5, 8-K Item 3.02), full-text searches to save, baby shelf math and cash runway.
- ATM offerings: how at-the-market offerings cap small-cap runnersWhat is an ATM offering? How at-the-market sales work, why they cap small-cap runners, how to spot an active one, and what the SEC's 2026 proposal changes.
Practice in SIM, against the live book.A lifetime license, every update included, with a 7-day refund guarantee.Ask in DiscordGet Scalpel